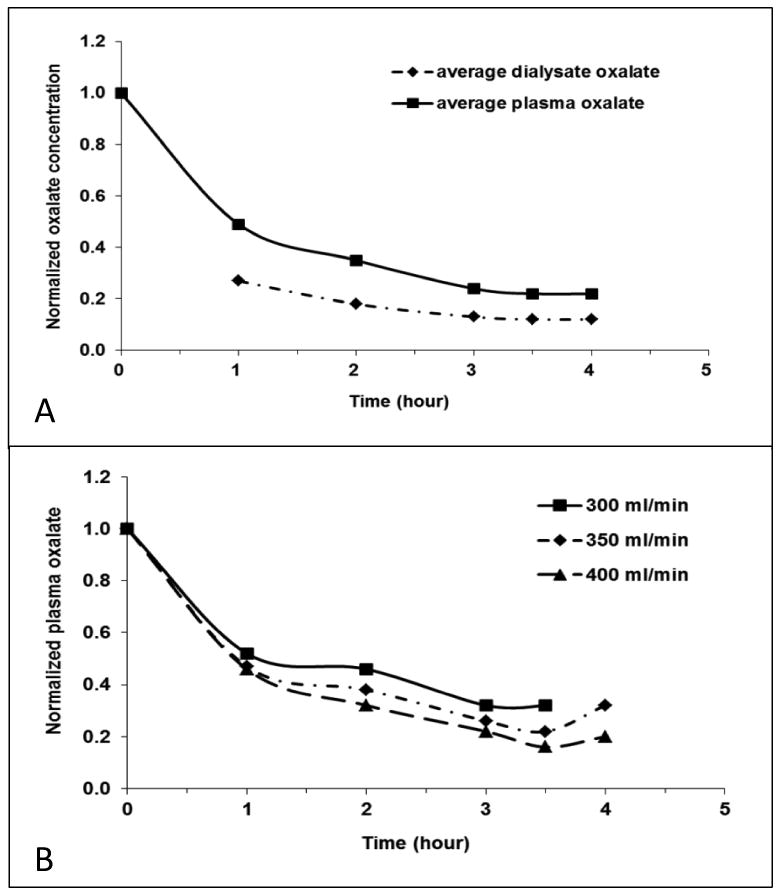
Figure 1. Plasma and dialysate oxalate kinetics.

Panel A: The average profile of plasma and dialysate change during one dialysis session. Normalized plasma and dialysate oxalate concentrations were calculated by plasma and dialysate oxalate of each hour in proportion to pre-dialysis plasma oxalate. Panel B: Influence of blood flow rate on oxalate removal. Dialysate flow rate was 800 ml/min for each measurement. The plasma oxalate levels were slightly lower at a blood flow rate of 400 ml/min (n=7) compared to 350 ml/min (n=4) or 300 ml/min (n=1) (P=0.76). The Analysis of Covariance (ANCOVA) was used to compare the slope of different blood flow rate.
