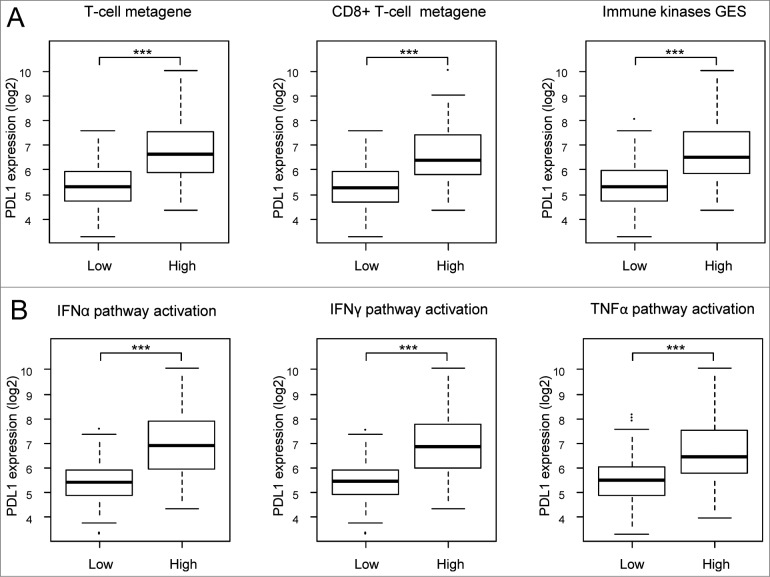
Figure 1.
Correlations of PDL1 expression with immune features. PDL1 expression levels reported as a box plot according to sample classifications based on gene expression signatures (A) including T cells (left) and CD8+ T cells (middle) metagenes and a prognostic immune kinase gene expression signature (right), and based on the probability of activation of immune pathways (B) including IFNα (left), IFNγ (middle), and TNFα (right). The P-values are indicated (Student's t-test) are indicated as follows: ***, P < 0.001.

