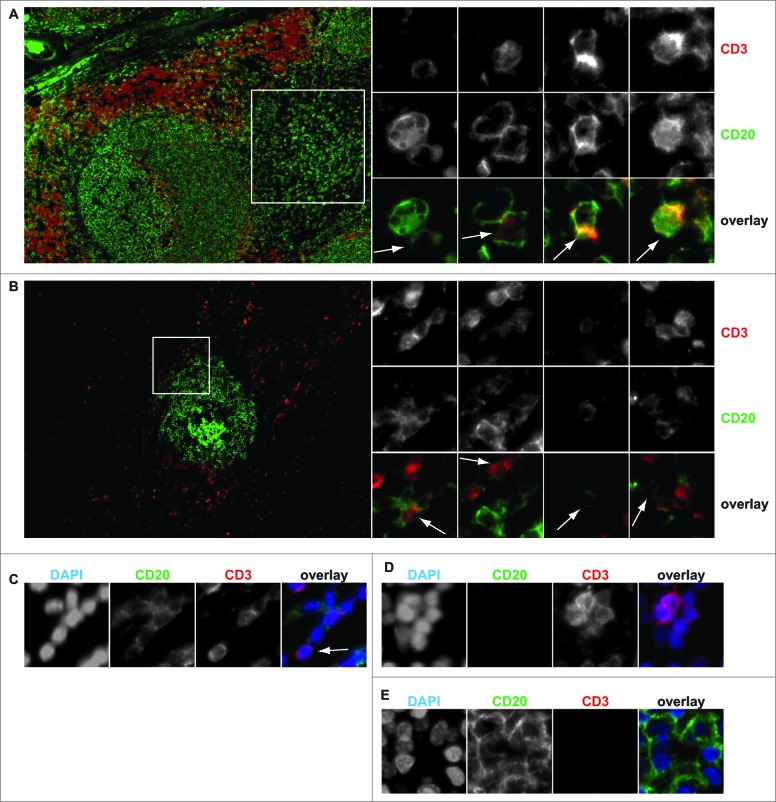
Figure 2.
In situ identification of CD3+ CD20+ T-cells. (A)Tonsil and (B)ovarian tumor tissue was stained for CD3 and CD20 and co-expression assessed by multicolor immunofluorescent microscopy. Insets identify the region where individual CD3+ CD20+ T cells could be identified. (C)single cell expression of CD3 and CD20 was validated using counterstaining with DAPI. (D)CD20− CD3+ T-cells and (E)CD20+ CD3− B cells could also be readily identified.

