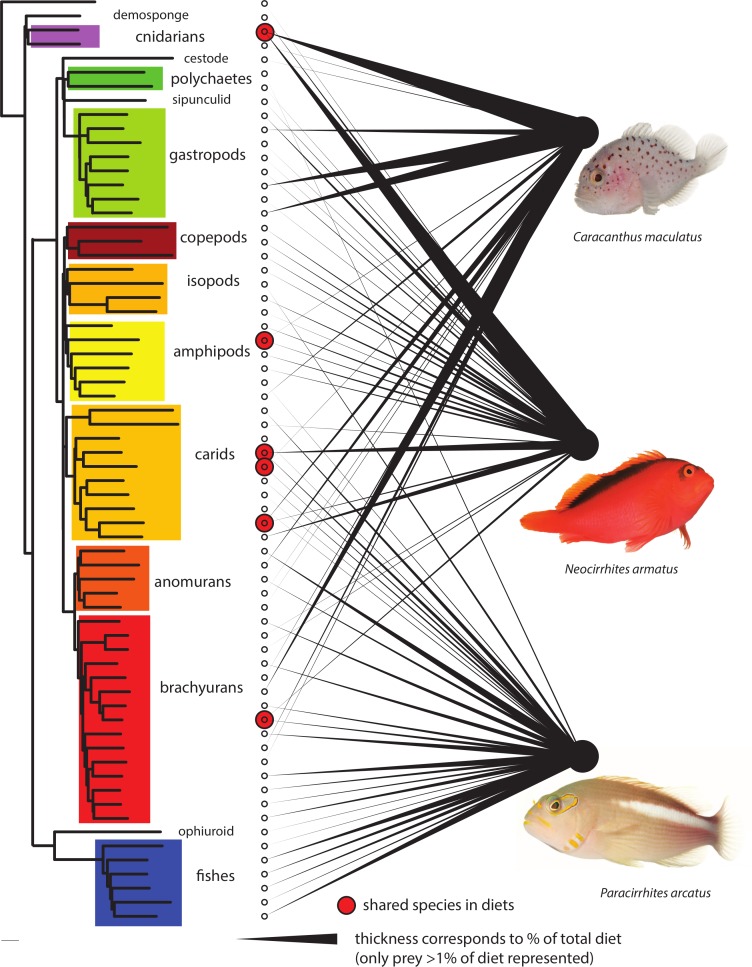
Figure 4. Dietary partitioning among the three predatory fish species.
Left neighbor-joining phylogeny using LogDet distance model based on a constraint topology of major clades represents relationship among the 66 prey OTUs that comprise >1% of any one species diet. Thickness of linkages to right represents relative proportion of predatory diets. Six shared species are highlighted with circles. Fish images courtesy of D. Liittschwager. The 66 OTUs are highlighted in Appendix S1.

