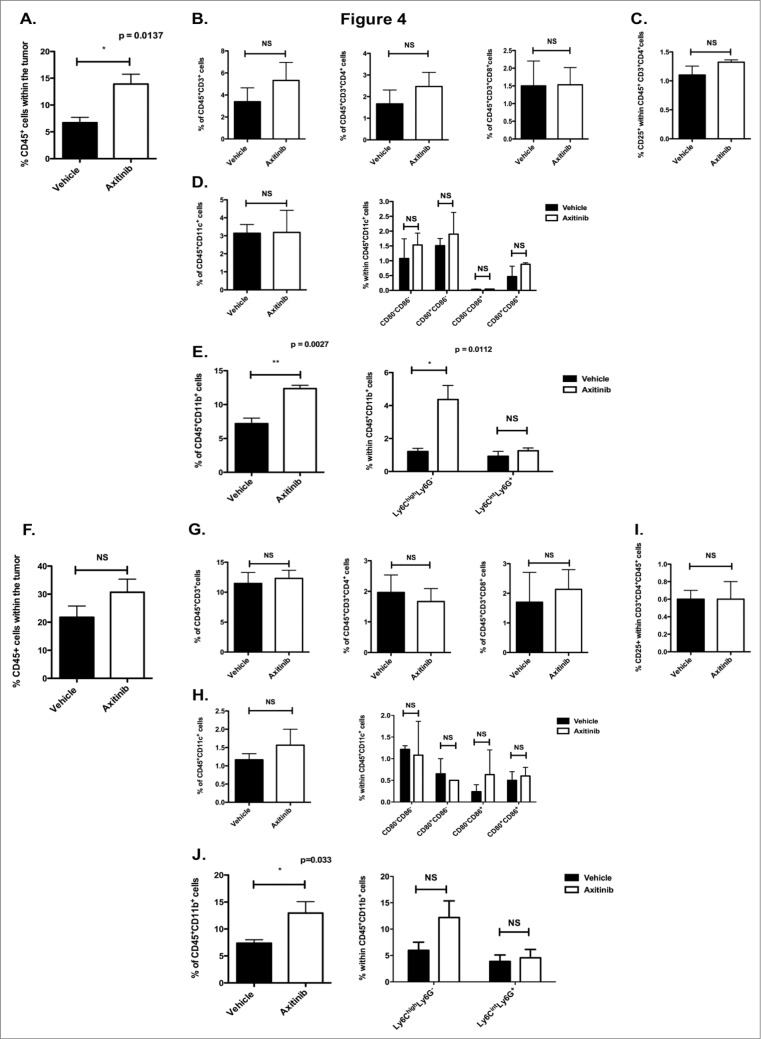
Figure 4.
(see previous page). In vivo treatment with axitinib increases the number of tumor-infiltrating immune cells, especially CD11b+ cells, in subcutaneous and intracranial tumor models. Determination of tumor-infiltrating immune cells in subcutaneous and intracranial MO4-bearing mice on the 7th day of treatment with axitinib at 25 mg/kg bid or vehicle by oral gavage. After sacrifice, single cell suspensions of the subcutaneous or intracranial tumors were made and subsequently analyzed by flow cytometry. A-E. Subcutaneous tumor. The total number of CD45+ cells was increased in axitinib-treated mice as compared to vehicle-treated mice (A.). This increase was due to an increase of CD11b+Ly6ChighLy6G- cells (E.). A. Percentage of CD45+ cells within the tumor. (B.) Percentage of CD45+CD3+ T cells within the CD45+ cell population. Within this population, the percentage of CD4+ and CD8+ T cells was determined. (C). Regulatory T cell population (Treg) within the CD4+ T cell population determined as CD4+CD25+ cells. (D). Percentage of CD11c+ cells (DCs) within the CD45+ cells and expression of CD80 and CD86 maturation markers on their surface. (E). Percentage of CD11b+ cells within the CD45+ cells. Within this population further characterization of the MDSCs: Ly6ChighLy6G- (moMDSC) and Ly6CintLy6G+ (grMDSC). Three independent experiments were performed (3 mice per group) and results are presented as mean ± SEM. F-J. Intracranial tumor. Similar to the subcutaneous tumor, the total number of CD45+ cells was increased (F.) in axitinib-treated mice as compared to vehicle-treated mice. That was also due to an increase of CD11b+ Ly6ChighLy6G- (J.) F. Percentage of CD45+ cells within the intracranial tumor. (G.) Percentage of CD3+CD45+ T cells within the CD45+ cell population. CD3+CD4+ and CD3+CD8+ T cells were determined within the CD3+ T cell population. (H.) Percentage of CD4+CD25+ cells (Treg) within the CD45+CD4+ T cell population. (I.) Percentage of CD11c+ population (DCs) within the CD45+ cell population and expression of the maturation markers CD80 and CD80 within this CD11c+ population. (J.) Percentage of CD11b+ cells (myeloid cells) within the CD45+ population. Further determination of the different MDSC subpopualtions through expression of Ly6C+ and Ly6G+: Ly6ChighLy6G- (moMDSC) and Ly6CintLy6G+ (grMDSC). Three independent experiments were performed (3 mice per group). Intracranial tumors were pooled from each group and results are presented as mean ± SEM.

