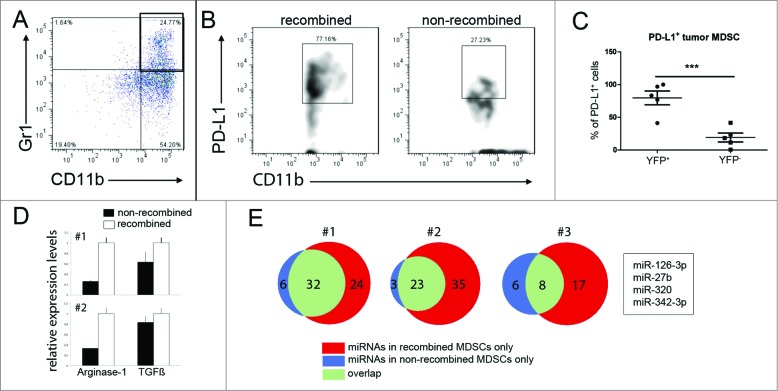
Figure 4.
Marker gene-positive MDSCs display enhanced immunosuppressive properties and differing miRNA profiles. (A–C) Leukocytes from mice bearing LLC2 analyzed by flow cytometry were gated on live MDSCs. Representative dot plots show CD11b+Gr1+ MDSCs (indicated in the black box) in lung tumors (A). (B) Recombined (left panel) or non-recombined (right panel) PD-L1-expressing MDSCs in tumors are presented. The gating for PD-L1 was done on the basis of the Fluorescence-Minus-One (FMO) control. (C) Cumulative data for PD-L1+ tumor- infiltrating MDSCs that took up EVs (YFP+) or failed to take up EVs (YFP-) are expressed as the percentage within all YFP+ or YFP- cells in the tumor and the measurement from the each individual mouse is represented as a single dot on the graph. Mean (SD); five mice per group, p = 0.0007 by one-tailed unpaired t test. (D) YFP+ and YFP- MDSCs were sorted from tumors of two reporter mice (#1 and #2, 2,500 cells). The expression of arginase-1 and TGF-β was quantified by TaqMan qPCR. Relative expression levels were set at the value one for recombined cells (empty bars), filled bars represent non-recombined MDSCs. The reaction was performed in triplicate, results are depicted as mean (SEM). (E) MDSCs from the same two mice (#1 and #2, 5,000 cells) and from one additional mouse (#3, 2,000 cells) were sorted, and their miRNA profile was measured by qPCR array. miRNAs listed in the box were present in LLC2 derived EVs and in all recombined but not in non-recombined MDSCs.

