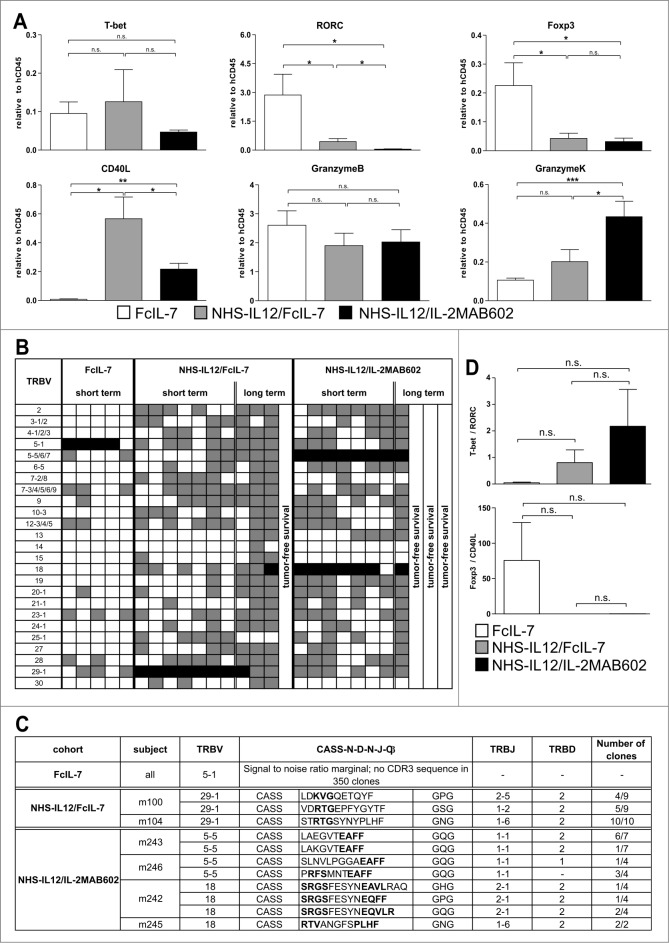
Figure 4.
Clonality analysis of αβ T cells treated with FcIL-7, NHS-IL12/FcIL-7, and NHS-IL12/IL-2MAB602. (A) Real-time PCR-based detection of various immune markers in tumor homogenates. Expression of the target gene was normalized to expression of human CD45. (B) Expression of 25 TRBV segments determined by CDR3-size spectratyping. Filled squares indicate expression of up to 12 fragments. Each vertical lane represents 1 mouse; dark squares indicate TRBV segments chosen for CDR3 sequence analysis. (C) CDR3 region protein sequences of selected TRBV segments; bold amino acid codes mark homologous sequences. (D) Expression ratios of T-bet/RORC and Foxp3/CD40L in tumor homogenates (n=4). *P ≤ 0.05, **P ≤ 0.01, ***P ≤ 0.001.

