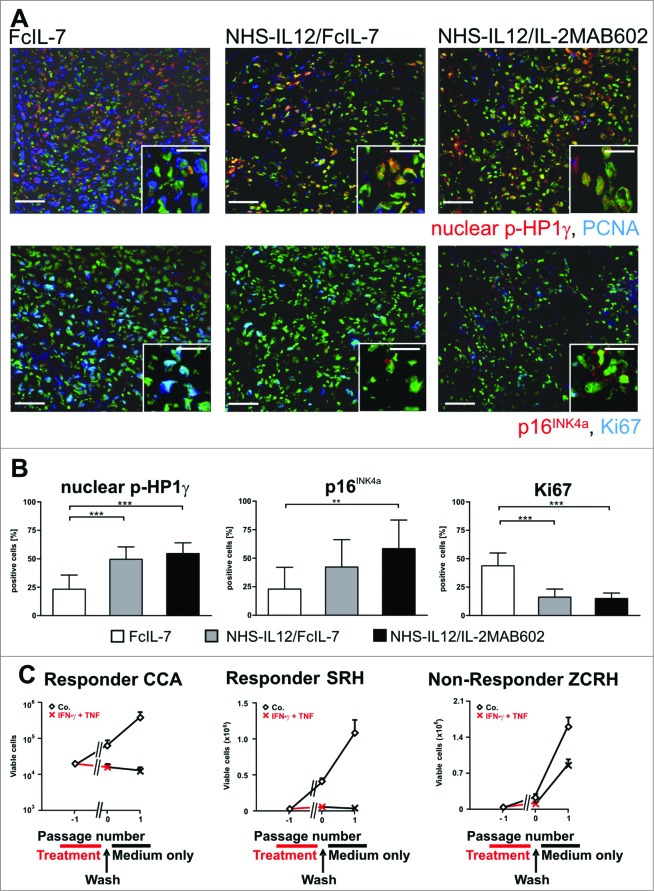
Figure 5.
Induction of senescence markers and antiproliferative effect of NHS-IL12/FcIL-7 and NHS-IL12/IL-2MAB602 treatment. (A) Cellular senescence and proliferation within tumor sections were determined by immunofluorescent double-staining for nuclear p-HP1γ or p16INK4a (red) in combination with PCNA or Ki67 (blue), respectively (1:100). Nuclei are shown in green. The inserts show a higher magnification (1:300) to visualize nuclear dots of p-HP1γ or p16INK4a staining. Scale bars represent 100 µm (1:100) and 30 µm (1:300). (B) Mean percentage of p-HP1γ-positive cells (i.e., cells with more than 5 nuclear dots), p16INK4a-positive cells (as determined by higher magnification [1:300]), or Ki67-positive cells after treatment with FcIL-7, NHS-IL12/FcIL-7, or NHS-IL12/IL-2MAB602 (n=3). ** P ≤ 0.01, *** P ≤ 0.001. (C) Cytokine-induced growth arrest in primary human RMS cancer cell preparations. CCA cells (eRMS, passage 7), SRH (eRMS, passage 8), or ZCRH cells (aRMS, passage >9) were seeded at a density of 2 × 10⁴ cells/9.6 cm2. On days 3 and 4 the cells were treated with 100 ng/mL IFN-γ and 10 ng/mL TNF or with medium alone (control). On day 7, the cytokines were removed and the cells were trypsinized, counted, and reseeded at 2 × 10⁴ cells/9.6 cm2. After incubation for another 4 d (ZCRH and SRH) or 10 d (CCA) living cells were counted. Growth curves of the responder cells CCA and SRH and the non-responder cells ZCRH in the absence (Co.) or presence of interferon gamma (IFN-γ) plus tumor necrosis factor (TNF) (n=3).

