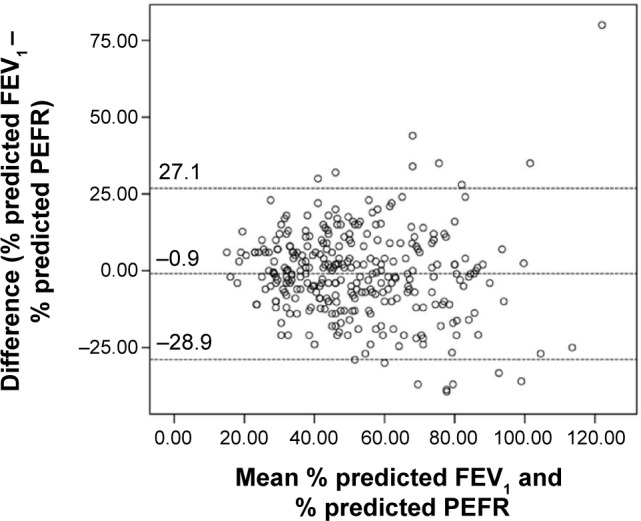
Figure 3.

Bland–Altman plot highlighting magnitude of difference between % predicted FEV1 and PEFR.
Note: Horizontal dashed lines represent the mean bias and its 95% confidence limits. Abbreviations: FEV1, forced expiratory volume in 1 second; PEFR, peak expiratory flow rate.
