Figure 6.
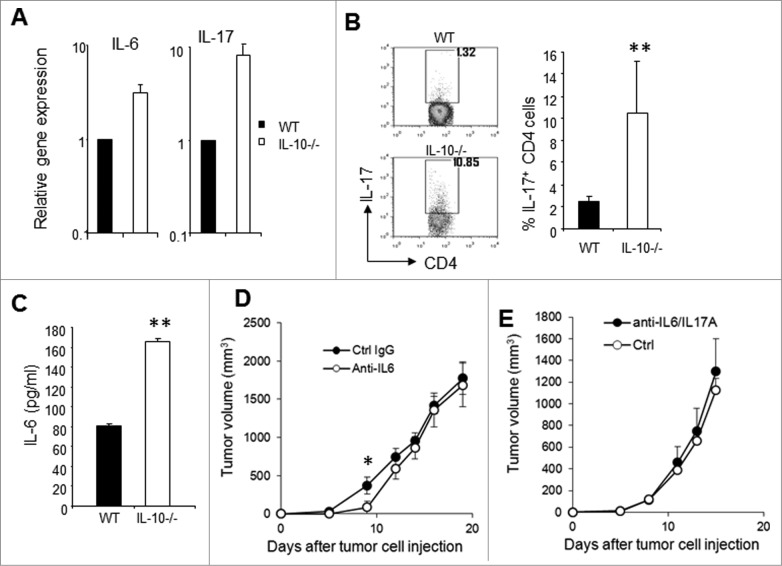
IL-6–Th17 axis in tumors from IL-10−/− and WT mice. (A) Total RNA was isolated from established J558 tumors from IL-10−/− (n = 3) or WT (n = 3) mice, and real-time PCR was performed to detect the expression of different genes. Data shown are representative of 2 experiments with similar results. (B) Intracellular IL-17 staining and flow cytometry analysis of tumor-infiltrating CD4+ T cells. Data in the right panel summarize the percentage of Th17 cells in tumors from IL-10−/−−(n = 13) or WT (n = 10) mice. (C) IL-6 concentration in tumor lysates (n = 3 per group) were determined by ELISA. (D) J558 cells (5 × 10⁶ cells) were injected subcutaneously into IL-10−/− mice. Four doses (day 1, 4, 7, and 10) of anti–IL-6 (MP5-20F3, n = 5) or control antibody (HRPN, n = 5) were injected into IL-10−/−mice at a dose of 400 μg/mouse and tumor size was measured over time. *P < 0.05 by Student t test. (E) J558 cells (5 × 10⁶ cells) were injected subcutaneously into IL-10−/− mice. Five doses (day 1, 4, 7, 10, and 14) of anti–IL-6 plus anti–IL-17A (MP5-20F3+17F3, n = 5) or control antibodies (HRPN plus MOPC-21, n=5) were injected into IL-10−/− mice at a dose of 400 μg/mouse/antibody and tumor size was measured over time.

