
Figure 1.
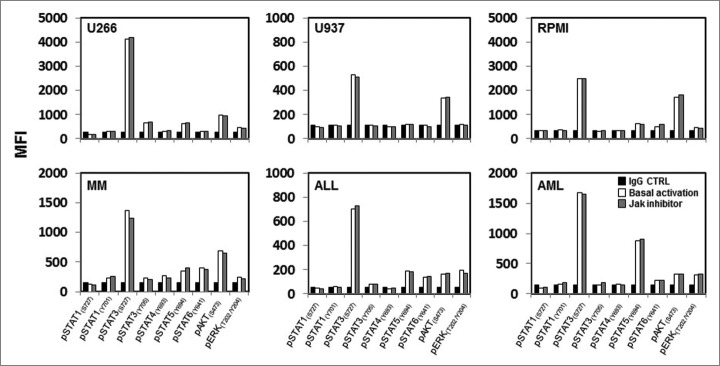
Baseline phosphorylation of STAT proteins, AKT and ERK in hematopoietic tumor cell lines and primary tumor cells. Representative examples of hematopoietic tumor cell lines or primary tumor cells analyzed for expression of several pSTAT proteins, pAKT and pERK at their basal level and after pre-treatment with a JAK inhibitor. Bar graphs indicate mean fluorescence intensity (MFI) expression determined by flow cytometry.