
Figure 3.
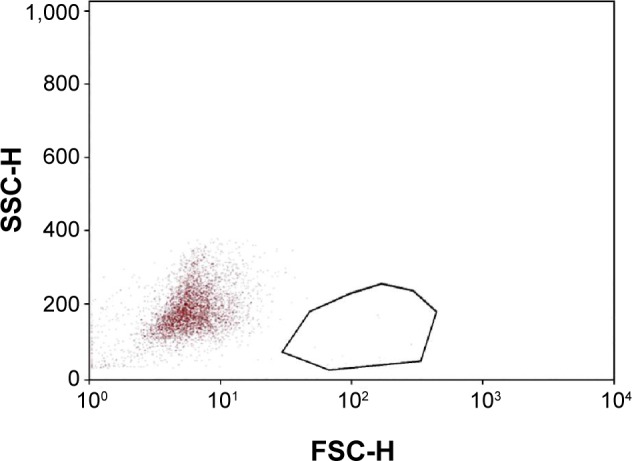
Representative dot plot of impression cytology samples collected after study treatment.
Notes: Samples were analyzed after cellular debris, aggregates, and naked antibodies were excluded. Cell size (forward scatter pulse height [FSC-H]) versus cellular granularity (side scatter pulse height [SSC-H]) of patient samples collected after 30 days of treatment is plotted. The outlined area demonstrates the subpopulation of cells highly expressing human leukocyte antigen D-related antigen. In each sample, 1,000–10,000 cells were analyzed. Samples containing less than 1,000 cells were discarded. A masked observer examined all specimens.