Fig. 4.

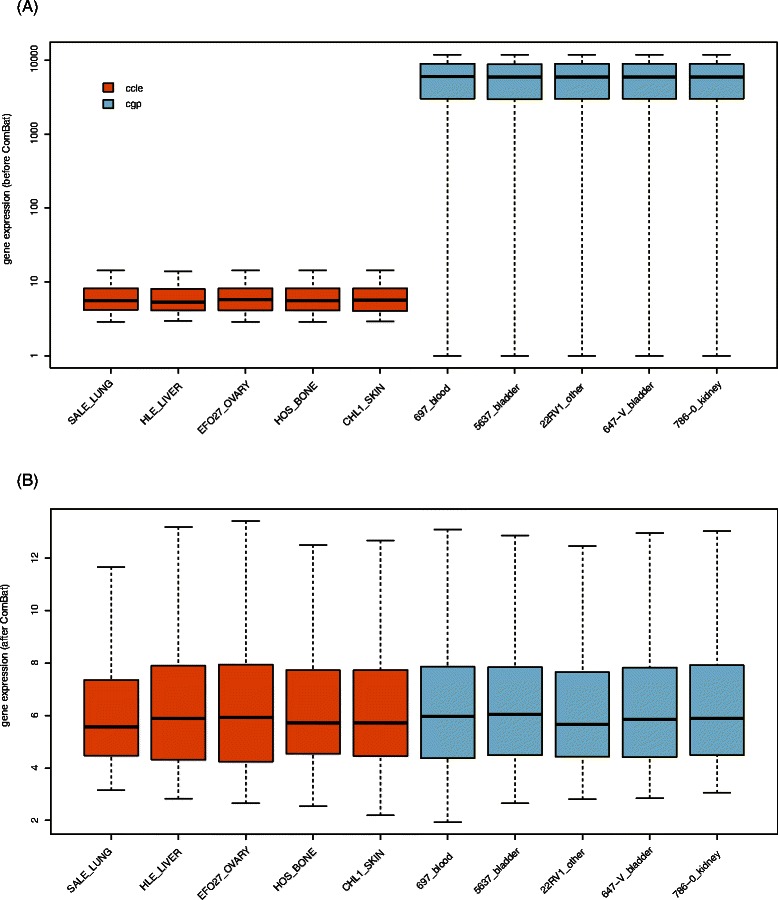
Elimination of Batch effect by ComBat. Boxplot showing gene expression distributions before (a) and after (b) ComBat for five cell lines in CCLE and CGP

Elimination of Batch effect by ComBat. Boxplot showing gene expression distributions before (a) and after (b) ComBat for five cell lines in CCLE and CGP