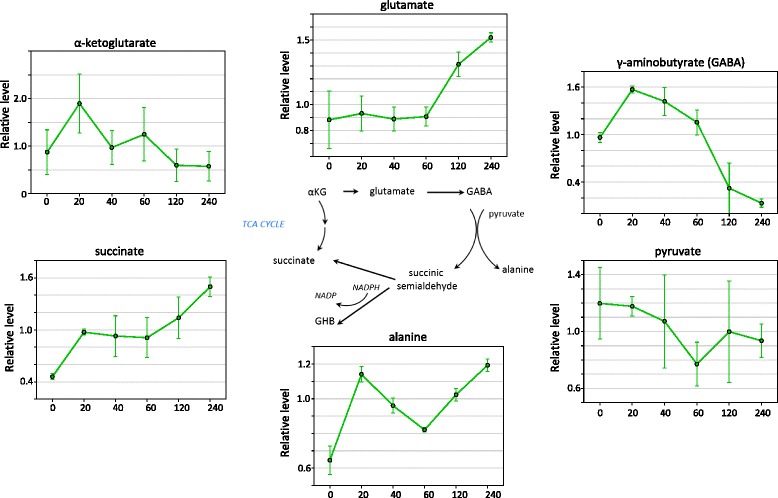
Figure 4.

Changes in the GABA Shunt during drought stress in leaves. The pathway is shown together with the relative levels of selected metabolites in the pathway. Error bars represent +/− one standard deviation. X-axes numbers represent dehydration time points in minutes. Y-axes values show the relative levels of the metabolite normalized to the median.
