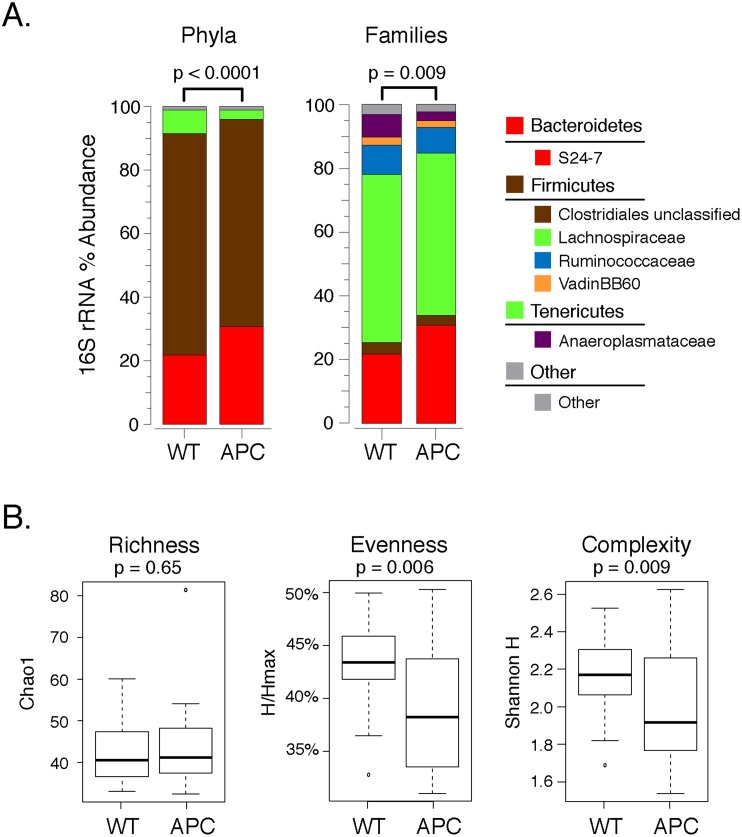
Fig 1. Comparison of phyla and families between wildtype (WT) and APCMin/+ (APC) mice.
A. The mean relative abundances of phyla (left panel) and families (right panel) as inferred from the 16S rRNA sequence analysis. Only phyla and families with relative abundances >0.5% are shown. The Hotelling T2 test was used to compare the overall microbial composition, with p-values noted above each barchart.

