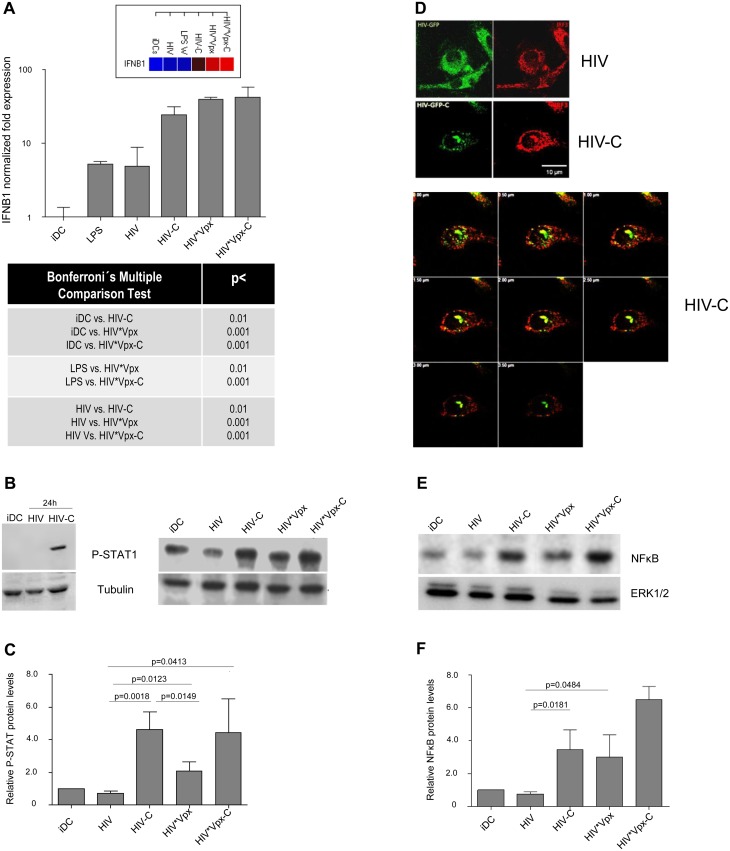
Fig 4. HIV-C activates type I IFN responses in DCs.
(A) mRNA expression of IFNB1 is induced to significantly higher levels in DCs loaded with C-opsonized or Vpx-containing HIV (HIV-C; HIV*Vpx- or HIV*Vpx-C) in contrast to iDCs or non-opsonized HIV (HIV). mRNA expression was relatively quantified using GAPDH gene expression as reference and the ΔΔCt method. Relative expression levels displayed as a cluster gram are depicted above the bar chart with blue/black representing lowest expression and red highest expression. Tabular statistics results from the same donor are illustrated below chart (One-way ANOVA using Bonferroni post-test for multiple comparisons). Relative quantification by RT-PCR was performed using cells from 4 donors (triplicates) and one representative donor is shown in the figure. (B) Phosphorylation of STAT1 (pSTAT1) was induced in DCs exposed to C-opsonized HIV after 24h (HIV-C; left, lane 3), while no STAT1 activation was detected in unstimulated DCs (iDC; left, lane 1) or DCs exposed to non-opsonized HIV (HIV; left, lane 2). Not only C-opsonized HIV (HIV-C; right, lane 3), but also C-opsonized Vpx-carrying HIV (HIV*Vpx-C; right, lane 5) activated STAT1 phosphorylation to higher levels compared to their non-opsonized counterparts (right, lanes 2 and 4) or iDCs (right, lane 1). Tubulin expression was used as control for proper loading and cell lysates from 4 different donors were analyzed. (C) pSTAT1 protein expression from 4 donors were summarized using ImageJ quantification. C-opsonization of HIV preparations (HIV-C, HIV*Vpx-C) led to significantly higher STAT1 activation in DCs after 24h compared to non-opsonized HIV or Vpx-carrying HIV (HIV, HIV*Vpx). (D) IRF3 (red) was translocated to the nucleus in DCs exposed to C-opsonized HIV (HIV-C; left, lower panel), whereas this translocation was not detected by confocal microscopy in DCs loaded with non-opsonized HIV (HIV, left upper panel). IRF3 (red) translocation is depicted by z-stack (0.5 μm steps, right) of DCs loaded with C-opsonized HIV (HIV-C; green, right). (E) Activation of NFkB was detected by Western blot analyses using an antibody directed against the nuclear localization sequence of human p65, therefore selectively binding to the activated form of NFκB. NFκB is strongly activated in DCs loaded with HIV-C and HIV*Vpx-C (lanes 3 and 5). A slight activation of NFκB is observed in HIV*Vpx-treated DCs (lane 4) compared to iDCs (lane 1) or HIV-DCs (lane 2). Western Blot analyses were repeated three times. (F) NFκB levels were relatively quantified as described in Fig 2B using values from three different donors and one-way ANOVA using Bonferroni post-test for multiple comparisons.

