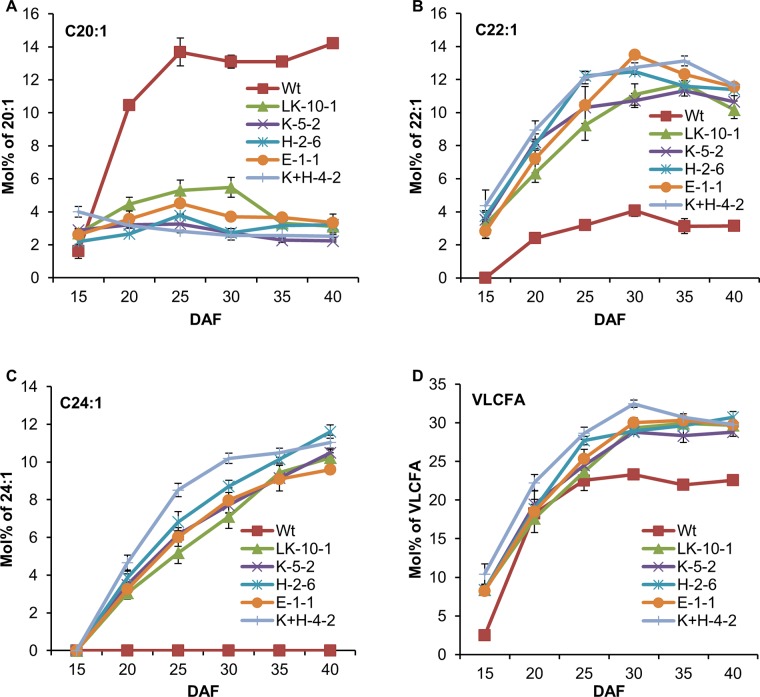
Fig 5. Fatty acid composition of seeds from non-transformed control (Wt) and T3 engineered camelina lines at different days after flowering (DAF).
(A). C20:1 content; (B). C22:1 content; (C). C24:1 content; (D). VLCFA content. LK-10-1 is the homozygous T3 line transformed with only LaKCS. K-5-2 is the homozygous T3 line transformed with LaKCS and AtKCR. H-2-6 is the homozygous T3 line transformed with LaKCS and AtHCD. E-1-1 is the homozygous T3 line transformed with LaKCS and AtECR. K+H-4-2 is the homozygous T3 line transformed with LaKCS, AtKCR and AtHCD. Data are presented as means with standard error bars SD, which were calculated based on 3–4 independent replicates. Samples from each replicate were measured using 20 developing seeds harvested at 25 days after flowering (DAF). Statistical significance was evaluated by ANOVA and Fisher’s least significant difference (LSD) multiple-comparison. The complete analyses are presented in Supporting Information S5 Table.

