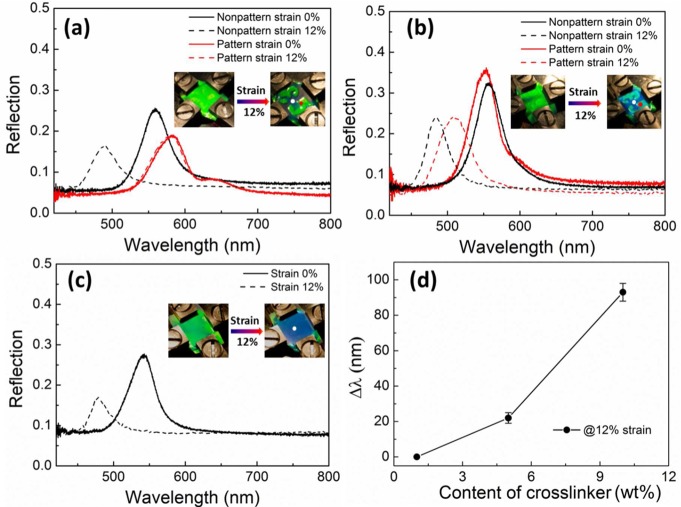
Figure 2.
Reflection spectra of POFs containing different amount (wt %) of benzophenone (a) 10%, (b) 5%, (c) 1%. The invisible patterns were printed under 2 h UV irradiation. Insets are images of POFs before and after 12% strain. White and red spots show collection regions of the reflection spectra. (d) Difference of peak reflection wavelengths from irradiated and nonirradiated regions under 12% strain.

