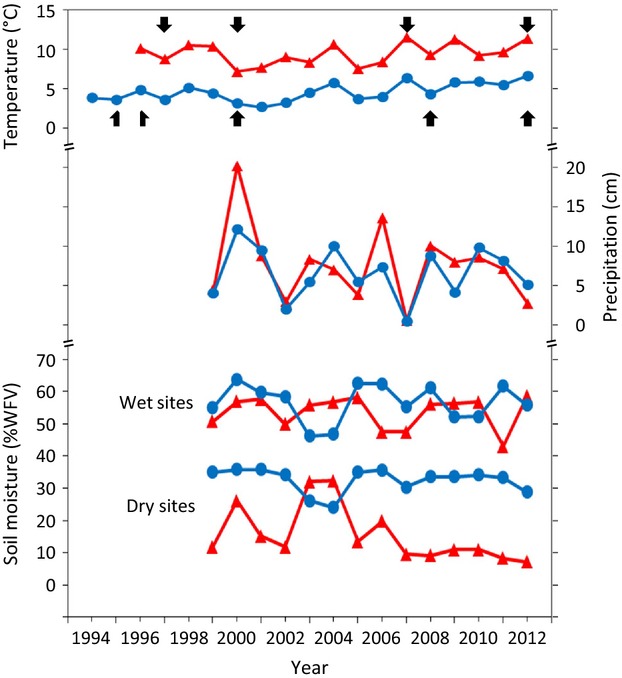
Figure 3.

Mean temperature (top), total precipitation (middle), and mean soil moisture (bottom) at the sites in Atqasuk (red triangles) and Barrow (blue circles) in July during the years of the study. Years when vegetation was sampled are noted with arrows. No precipitation or soil moisture information was available before 1999.
