
Figure 3.
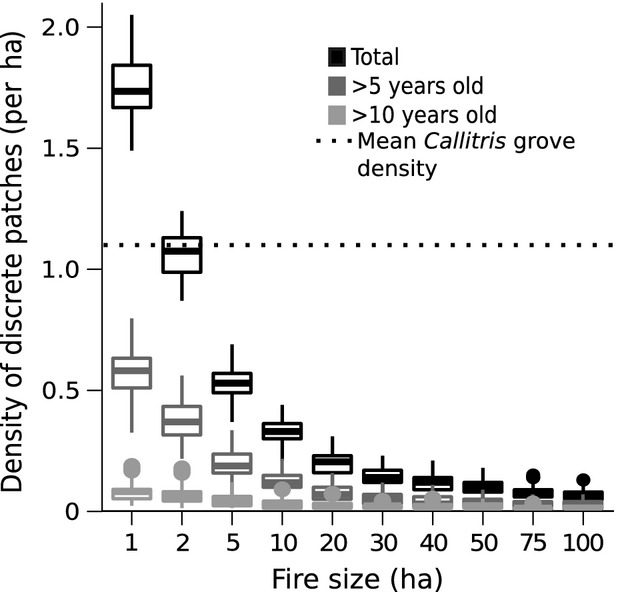
Results of fire simulations under different prevailing fire sizes for the total count of (i) discrete habitat patches (black), (ii) the count of habitat patches >5 years old (dark gray), and (iii) the count of habitat patches >10 years old (light gray), as sampled from a 100 ha plot at the center of a 900 ha landscape. Horizontal bars represent median values, boxes indicate the first and third quartiles, whiskers show the highest and lowest values within 1.5*IQR (the interquartile range), and points represent data lying outside this range.