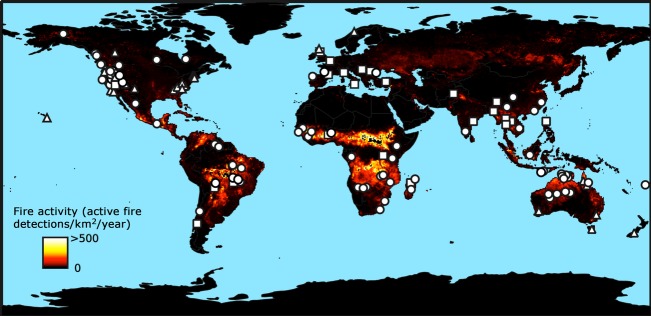
Figure 4.

The global distribution of indigenous and rural landscape burning covered in the literature (see Appendix S1). Circles indicate ethnographic studies (N = 74), triangles research using historical accounts (N = 29), and squares studies that provide descriptive accounts (N = 22) without reference to specific sources or data. Color coding illustrates ecosystem flammability using the mean annual density of active fire detections from MODIS satellite data between 2001 and 2006 (Giglio et al. 2006).
