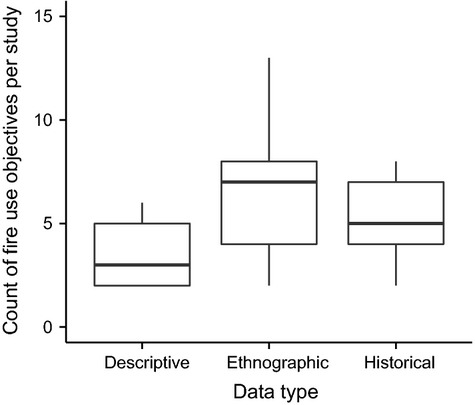
Figure 6.

Boxplots illustrating the count of objectives for intentional burning given per study from research on indigenous and rural fire management practices based on descriptive accounts (i.e., without specific reference to sources; N = 22), ethnographic studies (i.e., interviews with practitioners; N = 74), and historical accounts (derived from archival material like explorers’ journals N = 29). See Appendix S1 for references. Horizontal bars represent median values, boxes indicate the first and third quartiles, and whiskers show the highest and lowest values within 1.5*IQR (the interquartile range).
