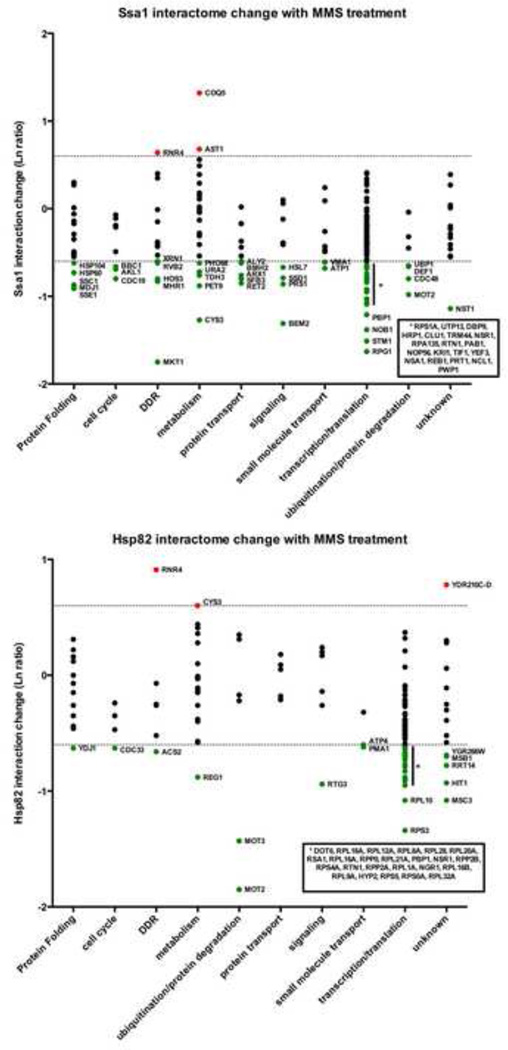
Figure 3. The dynamic Ssa1 and Hsp82 interactomes during the DNA damage response.
Interactors were organized into functional categories and plotted against interaction change (Ln ratio) with either A) Ssa1 or B) Hsp82 following MMS treatment. The dotted lines represent a two-fold interaction change up or down. Interactors are colored according to change in interaction as follows: red (significant increase), green (significant decrease) or black (no significant change).

