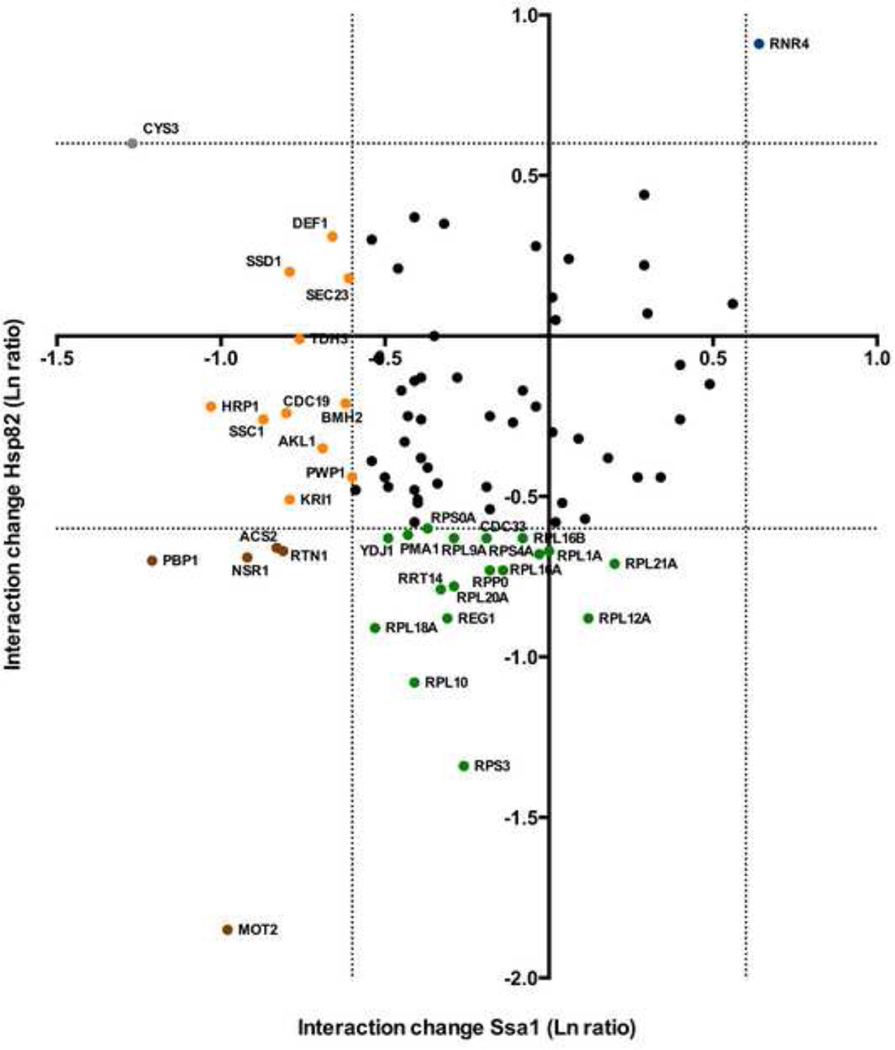
Figure 4. A direct comparison of interaction changes seen for each client against both Ssa1 and Hsp82.
For each interactor observed to bind both Ssa1 and Hsp82 in this study, change in association for Ssa1 (Ln ratio, X-axis) vs. change in association for Hsp82 (Ln ratio, Y-axis) was plotted. The dotted lines represent an interaction change of up or down two-fold. Interactors are colored according to significant change in chaperone association upon DNA damage as follows: blue (increased with both chaperones), brown (decreased with both chaperones), yellow (decreased with Ssa1), green (decreased with Hsp82), grey (increased with Hsp82), or black (no significant change with either chaperone).

