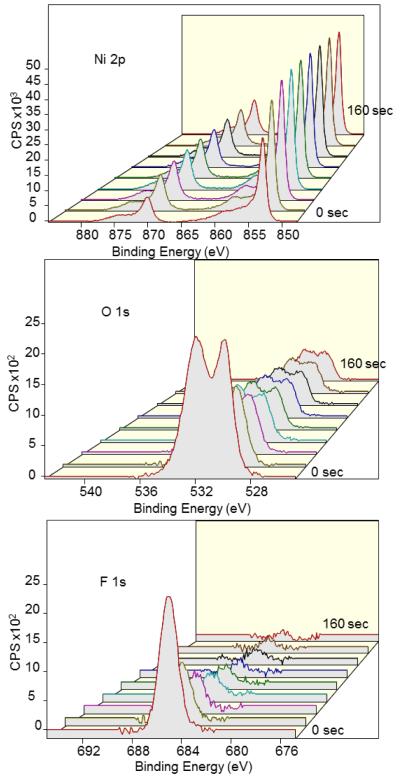
Figure 11.
XPS depth profiling of Ni anode with adsorbed fluoride by ion milling from 0 to 160 sec in 20 sec increments (front to back) showing Ni 2p (top), O 1s (middle), and F 1s (bottom) peaks. The composition % of Ni substrate increases as the surface is cleaned via ion etching. XPS spectra of O 1s and F1s suggest that fluoride and oxides are much more confined to the surface in comparison to that of Cu and Zn.

