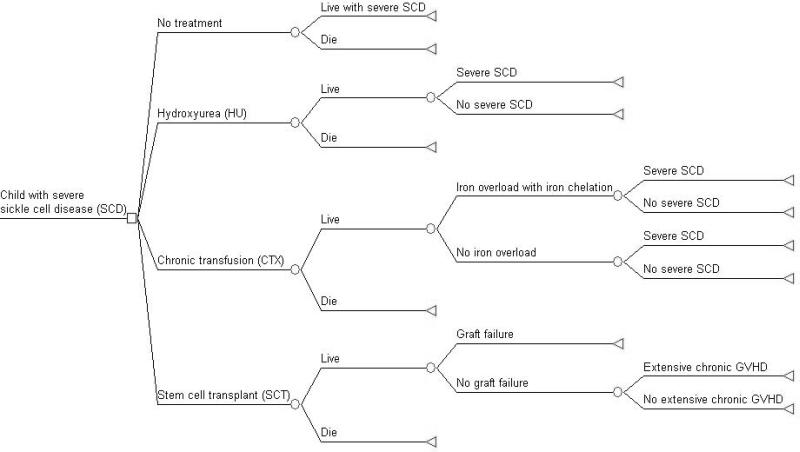
FIGURE ONE.
A schematic representation of the decision analysis model. The square node on the left represents the decision to choose one of four possible treatment strategies. Circular nodes represent chance events, such as the five-year probability of iron overload, graft failure, or death. Triangular nodes at the end of each path in the tree represent the health state utility (quality of life) associated with the full sequence of events in that particular path.

