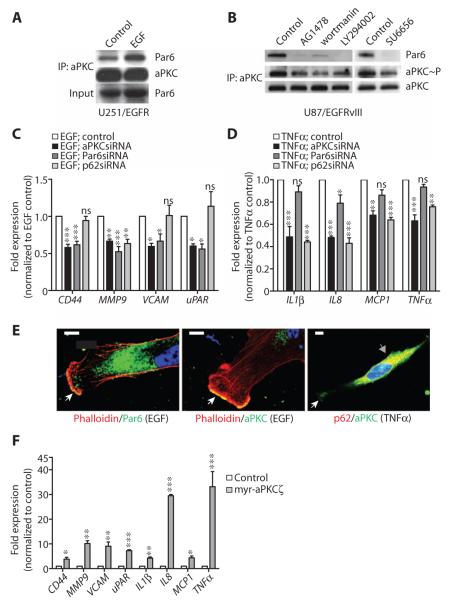
Fig. 6. aPKC functions in both EGF- and TNFα-induced signaling in glioblastoma cells.
(A) Coimmunoprecipitation of Par6 with aPKC in serum-starved U251/EGFR cells after EGF treatment. aPKC immunoprecipitates were sequentially probed with Par6 and aPKC antibodies. Lysates were immunoblotted for Par6. (B) Coimmunoprecipitation of Par6 and activation of aPKC in U87/EGFRvIII cells grown in serum after incubation with AG1478, wortmannin, LY294002, or SU6656. aPKC immunoprecipitates were sequentially probed with Par6, phospho-aPKC Thr410/403, and aPKC antibodies. (C) Expression of the indicated genes in EGF-treated U251/EGFR cells transfected with aPKC, Par6, or p62 siRNAs, as determined by RT-qPCR. Expression was normalized to control U251/EGFR cells. (D) Expression of the indicated genes in TNFα-treated U251/EGFR cells transfected with aPKC, Par6, or p62 siRNAs, as determined by RT-qPCR. Expression was normalized to control U251/EGFR cells. (E) Representative images showing the colocalization of aPKC and Par6 with phalloidin at lamellipodia in EGF-stimulated U251/EGFR cells (white arrows, left and middle panels) and the colocalization of aPKC and p62 in the intracellular compartment in TNFα-treated U251/EGFR cells (gray arrow, right panel). Some aPKC was detectable at the lamellipodia of the cells (white arrow). Scale bar, 10 μm. (F) Expression of the indicated genes in U251 cells transfected with myr-aPKCζ, as determined by RT-qPCR. Expression was normalized to the mRNA abundance in untransfected U251 cells. Data for (A) to (F) are presented as representative images or as means ± SEM of at least three independent experiments. *P < 0.05; **P < 0.01; ***P < 0.001; ns, nonsignificant.

