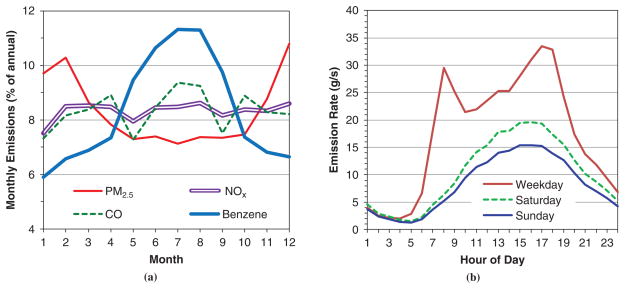
FIGURE 4.
Variation of emissions across Detroit road network: (a) monthly of four pollutants (numbers on x-axis refer to month, e.g., 1 = January, 2 = February) and (b) hourly of PM2.5 emissions for weekdays, Saturdays, and Sundays, averaged across 2010 (numbers on x-axis refer to times on 24-h time system).

