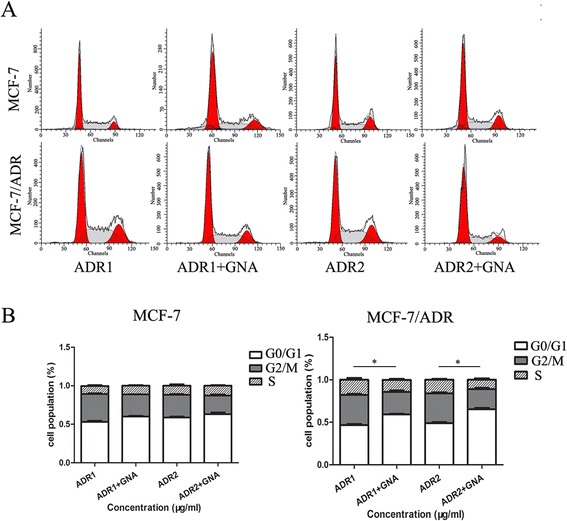
Fig. 3.

Effects of ADR and GNA on the cell cycle of MCF-7/ADR and parental MCF-7 cell lines in vitro (* P < 0.05). a and b The bar chart represents the percentage of cells in the G0/G1, S, or G2/M phases, as indicated. The data represent the means ± S.D. from three independent experiments
