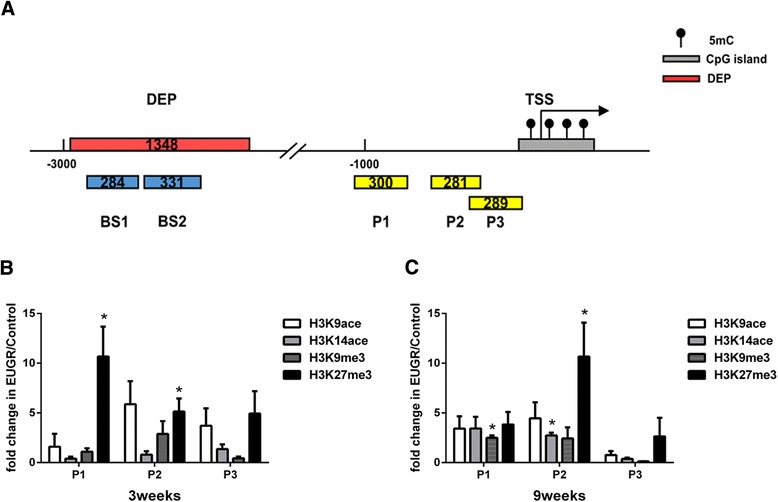
Fig. 4.

Histone modifications of the Notch1 gene promoter in rats at 3 and 9 weeks. a Schematic illustration showing the different enrichment peak (red bar) detected by Medip-chip in the distal promoter of the Notch1 gene and the region analyzed by bisulfite sequencing (BS) (blue bar). ChIP-qPCR analysis of regions proximal to the transcription start site are also indicated (yellow bar). The distribution pattern of four histone modifications at three sites in the proximal promoter (<−1500 bp) of Notch1 at (b) 3 weeks and (c) 9 weeks, analyzed by ChIP/real-time qPCR. Data are presented as mean ± SEM. (PVECs from 9 rats of each group were assessed). *P < 0.05
