
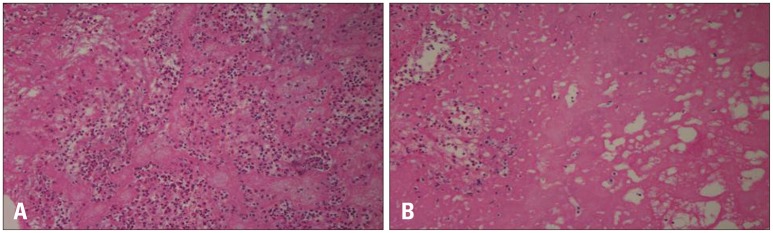
Fig. 2. Histopathologic analysis of left ventricle shows fibrin clot with blood clot, inflammatory cells (A) and eosinophil infiltration (B) (hematoxylin and eosin stain, × 200).
Official websites use .gov
A
.gov website belongs to an official
government organization in the United States.
Secure .gov websites use HTTPS
A lock (
) or https:// means you've safely
connected to the .gov website. Share sensitive
information only on official, secure websites.