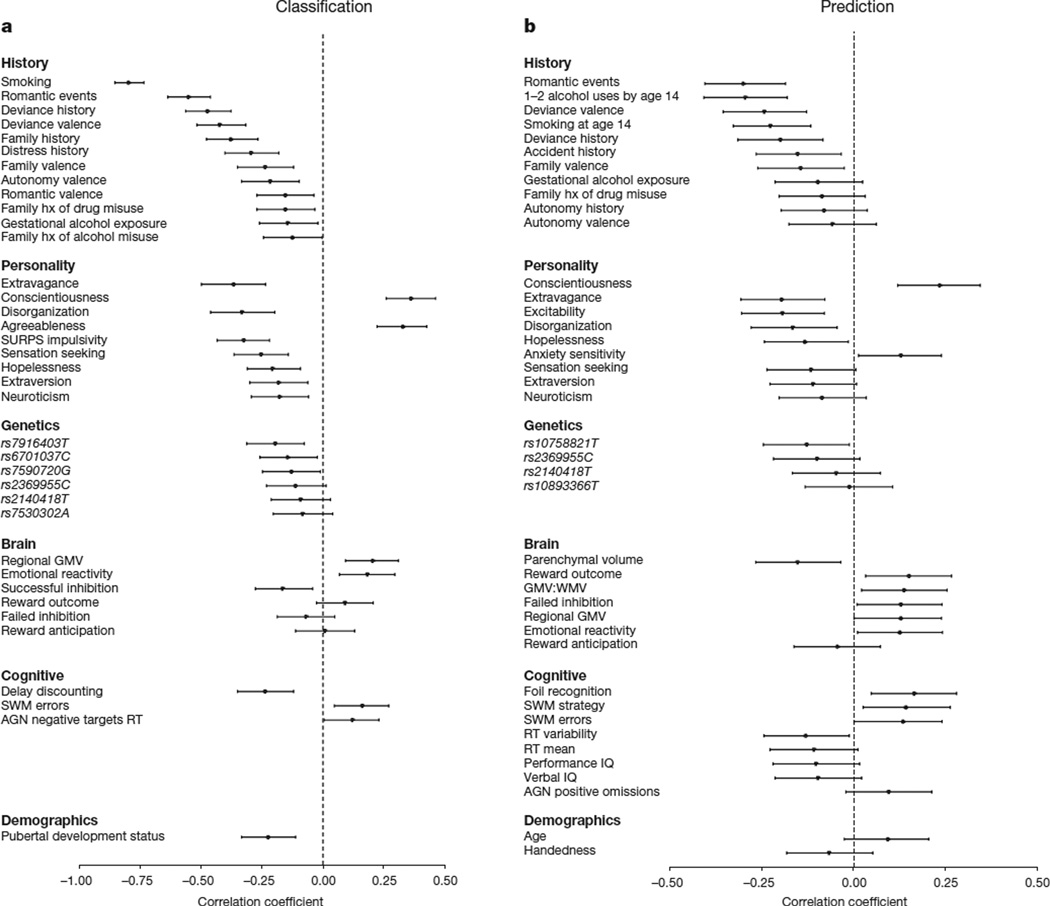
Figure 1. The relationship between group membership and each feature that was present in at least 9 folds of the final model.
Position on the horizontal represents the point-biserial correlation statistic (r) between each feature and group membership. Negative r values indicate that higher scores are associated with an increased likelihood to engage in binge drinking at 14. Error bars represent 95% confidence intervals (calculated using 10,000 bootstraps). a, Analyses 1 and 2, the classification of binge drinking at age 14 years (n = 265). b, Analysis 8 predicting binge drinking at age 16 years (n = 271). AGN, affective go/no go; hx, history; SURPS, substance use risk profile scale; SWM, spatial working memory; GMV, grey matter volume; WMV, white matter volume.

