
Figure 2.
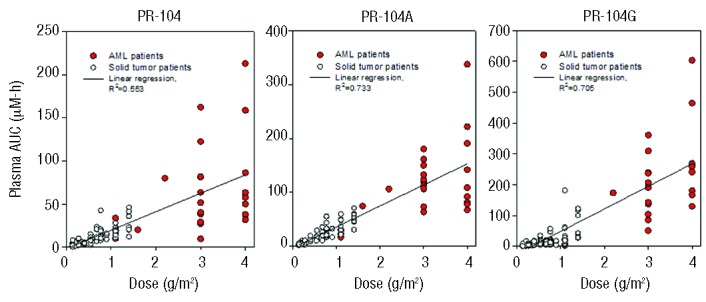
Plasma pharmacokinetics of PR104 and its major metabolites PR104A and PR104G, comparing acute myeloid leukemia (AML) patients (colored symbols) and solid tumor patients (data from refs. 13,14,32). Values are AUC (area under the concentration-time curve) for each patient, and lines are the linear regressions through all data.