
Figure 4.
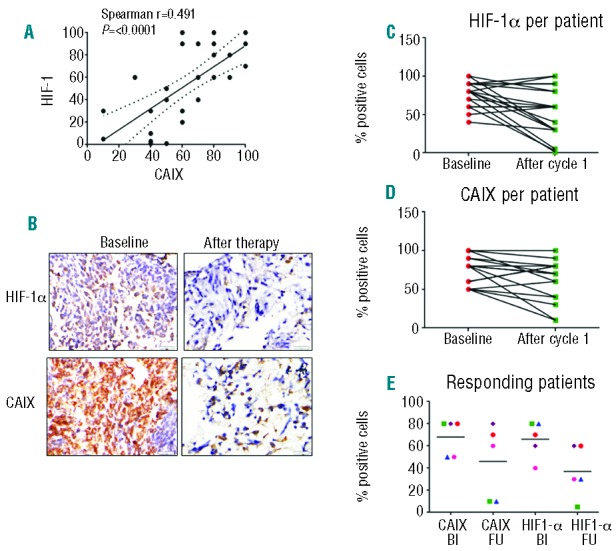
(A). Correlation between proportions of HIF-1α– and CAIX-positive cells (all samples included, before or after therapy). (B). HIF-1α and CAIX were detected by immunohistochemical staining in BM biopsy specimens of ALL Patient 182-1018 (baseline BM blasts, 67%; day 14, 40%). HIF-1α– and CAIX-positive cells, before and after PR104: 80% vs. 19% and 80% vs. 5%. (C and D). Proportions of HIF-1α– and CAIX-positive cells before and after PR104, in all samples tested. (E). Proportions of HIF-1α– and CAIX-positive cells before and after PR104, in 5 responding patients; Bl: baseline; FU: follow up. Symbols represent patients as follows: green square: Patient 1018 (best response, MLFS); blue triangle: Patient 1023 (best response, CRp); red circle.