
Figure 1.
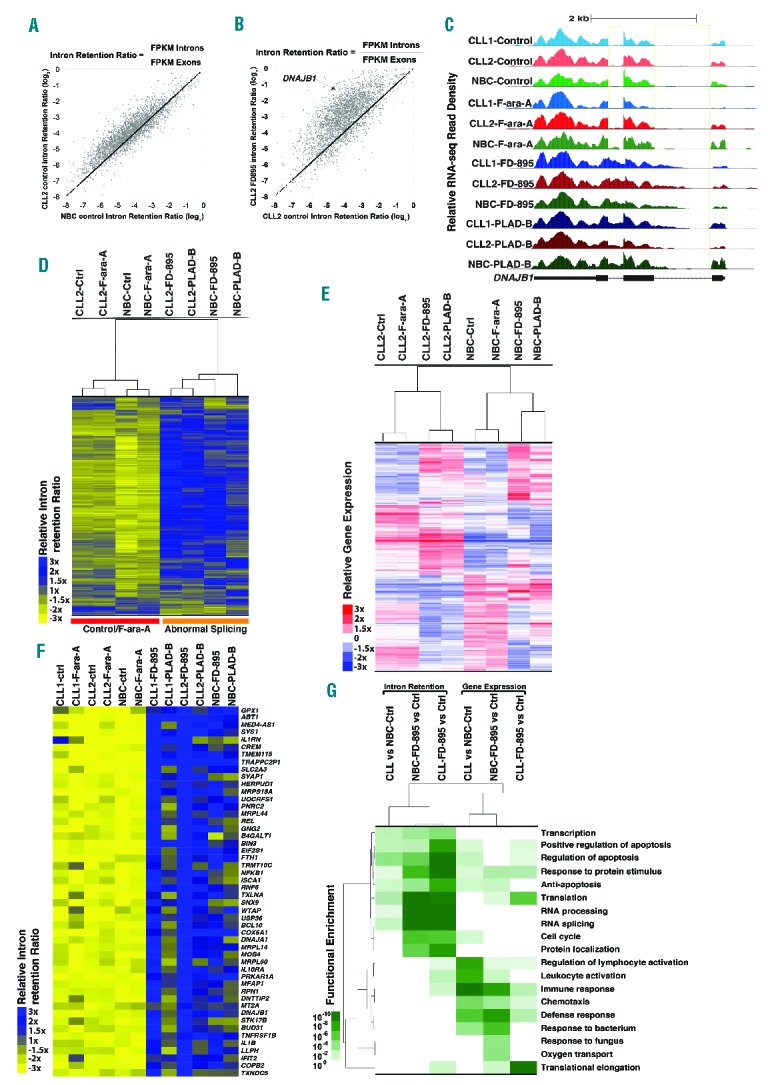
RNA sequencing analysis in samples treated with FD-895 and PLAD-B. RNA transcriptome analysis was conducted on RNA obtained from two separate CLL samples (wild-type for TP53 and SF3B1) and normal B cells from healthy controls. CLL and normal B cells were incubated with 100 nM FD-895, 100 nM PLAD-B or 10 μM F-ara-A for 2 h prior to harvesting. (A) Comparison of IR log2 ratios [fragments per kilobase per million fragments mapped (FPKM) intron / FPKM exon] in untreated CLL and untreated normal B cells. The black line represents the diagonal where IR ratios are equal in both samples. (B) Comparison of IR log2 ratios in CLL control and FD-895-treated samples. (C) RNA-seq read densities at the DNAJB1 locus, a sample gene with high IR pattern. FD-895- and PLAD-B-treated samples but not F-ara-A-treated or untreated controls showed a pattern of IR with accumulation of read densities in the regions expanding introns 1 and 2. (D) Hierarchical clustering for approximately 3,500 genes shown in the heat-map depicting the relative IR log2 ratios. (E) Gene expression across normal B cells and CLL samples treated with FD-895, PLAD-B and F-ara-A shown in the heat-map for approximately 4,000 genes. A similar clustering was observed with additional CLL and normal B-cell samples. (F) RNA-seq heat map showing 50 genes with a high level of IR after treatment with either FD-895 or PLAD-B. (G) Heat-map showing gene ontology pathway enrichment (P-values) using genes with greater than 3-fold increases in either their IR or mRNA expression ratios in CLL or normal B cells in untreated control samples compared with samples incubated with FD-895.