
Figure 4.
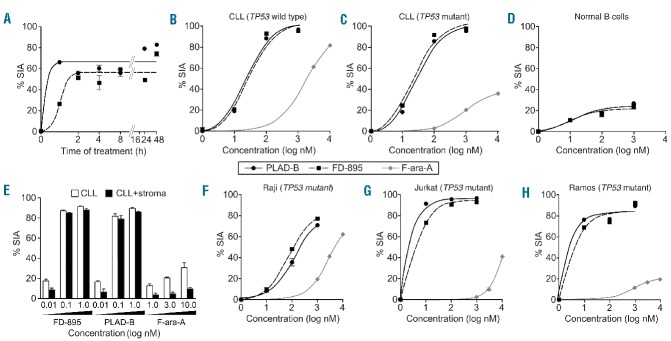
FD-895 or PLAD-B induced apoptosis in CLL cells but not in normal lymphocytes with TP53-independent activity. (A) Primary leukemia B cells alone from a CLL patient were treated with 100 nM FD-895 or 100 nM PLAD-B at time 0 and allowed to incubate for 0.5 h, to 48 h. After initial incubations, the cells were washed twice with fresh media to remove the remaining FD-895 or PLAD-B and then were cultured using media only for a total of 48 h. The dark black line indicates FD-895 and the light color line indicates PLAD-B. Apoptosis was measured by flow cytometry using a PI/DiOC6 assay. (B–D) Cells from different sources were evaluated for their level of apoptosis after incubation with FD-895, PLAD-B or F-ara-A for 48 h, including: (B) cells from a CLL patient with wild-type TP53 and sensitive to F-ara-A; (C) cells from a CLL patient with Del(17p) and TP53 mutation (TP53-mut), resistant to F-ara-A; and, (D) normal B cells from a healthy donor. (E) Primary CLL cells derived from a Del(17p) patient were treated alone or co-cultured with stroma-NK-tert cells with FD-895, PLAD-B, or F-ara-A for 48 h. Apoptosis was measured by flow cytometry using a CD19/CD5/DiOC6 assay. (F-H) In parallel, cell lines with different TP53 mutation status were incubated with FD-895, PLAD-B or F-ara-A: (F) Raji - TP53 mutant type; (G) Jurkat cells - TP53 mutant; (H) Ramos cells - TP53 mutant. After incubation, apoptosis was assessed by flow cytometry. These results are representative of at least three separate experiments. In order to discriminate the compound specific-induced apoptosis vs. background spontaneous cell death from in vitro culture conditions, we calculated the percentage of specific induced apoptosis (% SIA) using the following formula: % SIA = [(compound induced apoptosis − media only spontaneous apoptosis) / (100− media only spontaneous apoptosis)] × 100.