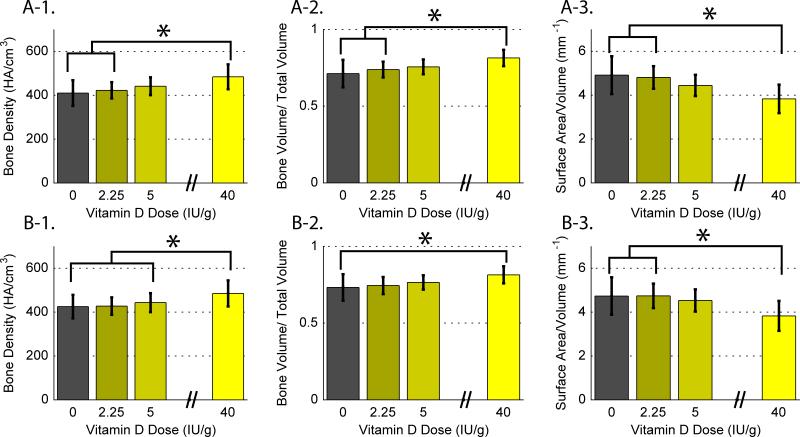
Figure 6.
MicroCT data for each vitamin D diet group, presented as the average +/−sd. (6-1) bone mineral density (BMD, HA/cm3) (a) for all specimens, and (b) excluding infected rat data, (6-2) bone volume fraction (BV/TV) (a) for all specimens, and (b) excluding infected rat data, and (6-3) bone surface to volume ratio (BS/BV, mm-1) (a) for all specimens, and (b) excluding infected rat data.

