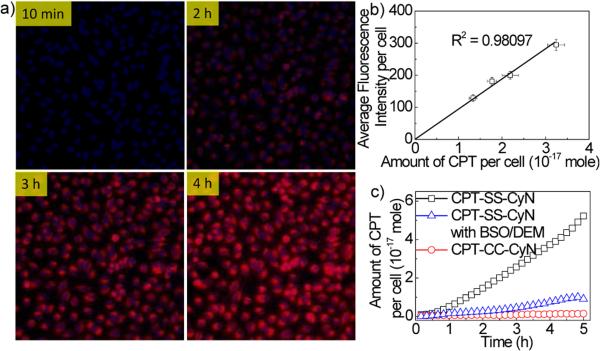
Fig. 2.
(a) Fluorescence microscopy images of HeLa cells incubated with CPT-SS-CyN using the GE In-Cell Analyzer. The cells were incubated with serum free DMEM medium containing CPT-SS-CyN (0.5 μM), and then the images were obtained at each time point (10 min, 2, 3, and 4 h) at 37 °C. The nucleus was stained with Hoechst. The cell images were obtained using the DAPI channel (excitation at 320-370 nm, emission at 430-580 nm) and the Cy5 channel (excitation at 640-660 nm, emission at 680-750 nm). (b) Relationship between average fluorescence intensity per cell (background fluorescence signal has been subtracted) and the amount of CPT released per HeLa cell. (c) Amount of CPT released from CPT-SS-CyN with/without BSO/DEM inhibitors and CPT-CC-CyN with incubation time in HeLa cells. The cells were incubated with serum free Opti-MEM medium containing CPT-SS-CyN (0.5 μM), and then the images were obtained every 10 min at 37°C. The nucleus were stained with Hoechst. The cells were imaged using the DAPI channel (excitation at 320-370 nm, emission at 430-580 nm) and the Cy5 channel (excitation at 640-660 nm, emission at 680-750 nm).

