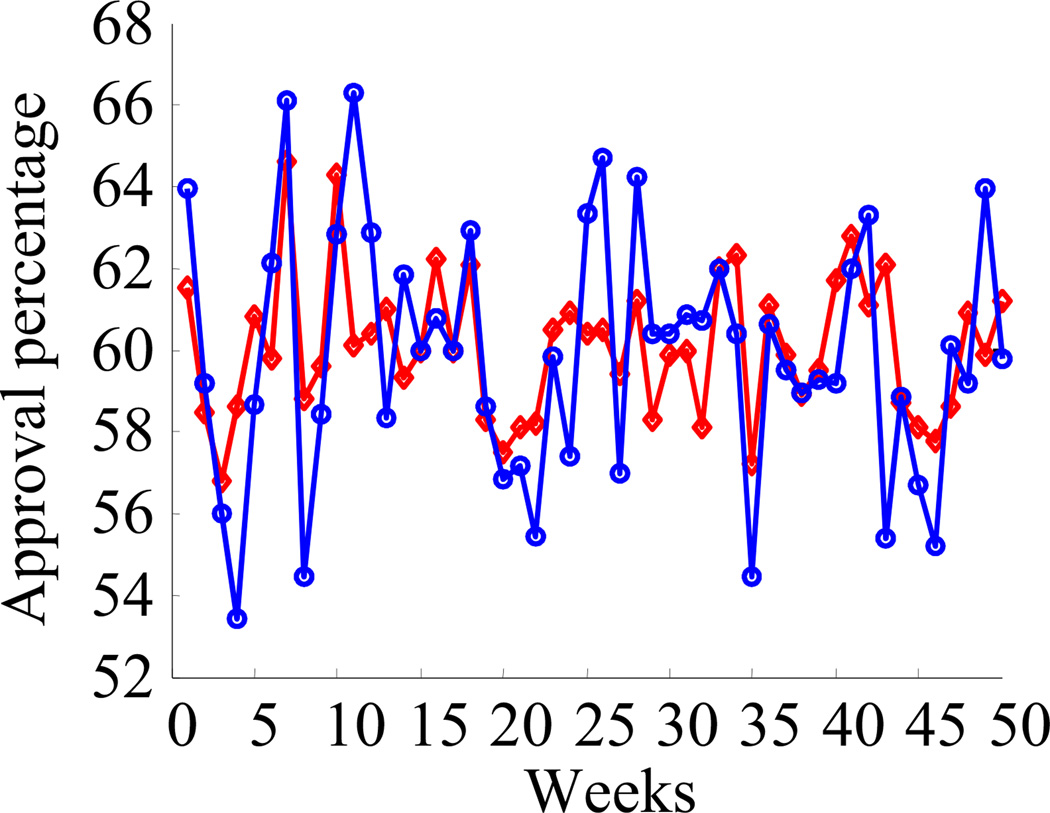
Figure 2. Variability Induced by Suboptimal Inference.
The plot shows the fluctuations in estimated approval ratings using two different methods. In popt (red), the estimate from the two different companies are combined optimally, while in pav (blue), they are combined suboptimally. Note that the variability in pav is greater than the variability in popt. This additional variability in pav is not due to noise; it is due to suboptimal inference caused by a deterministic approximation of the assumed statistical structure of the data.

