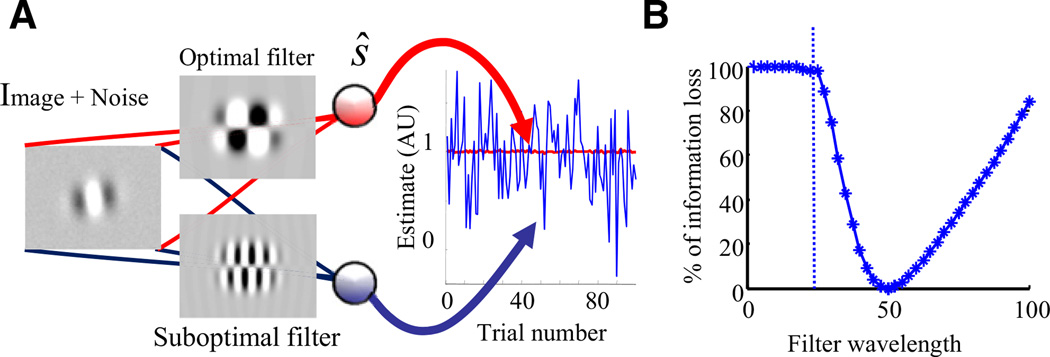
Figure 3. Amplification of Noise by Suboptimal Inference.
(A) The image consists of a Gabor patch oriented at either +5° or −5°, plus small additive noise on each pixel. Both units compute the dot product of the image with a linear filter (their feedforward weights) to yield a decision of which stimulus is present. The top unit uses the filter that discriminates optimally between these two particular oriented stimuli. In contrast, the bottom unit uses a filter that is optimized for a Gabor patch with twice the frequency of the patch in the image. The plot on the right shows the activity of the two units for 100 presentations of the Gabor patches, all oriented at +5° but with different pixel noise. The filters have been normalized to ensure that the mean response is 1 in both cases. The standard deviation of the bottom unit (blue) is 54 times larger than the standard deviation of the top unit (red; although the trace looks flat, it does in fact fluctuate). In other words, more than 98% of the variability of the bottom unit is due to the use of a suboptimal filter.
(B) Percentage of Fisher information loss as a function of the wavelength of the filter. The information loss increases steeply as soon as the wavelength of the filter differs from the wavelength in the image (set to 50).

