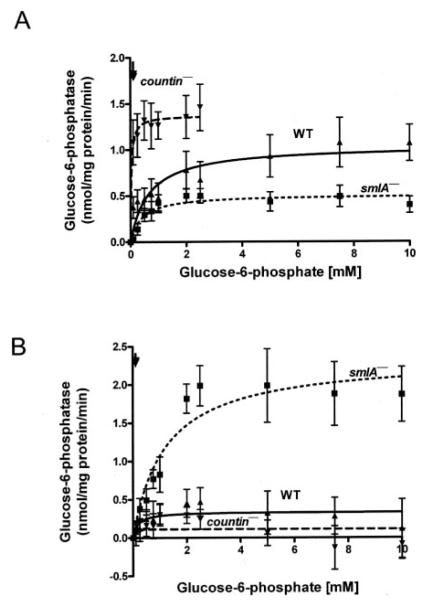
FIGURE 1. Cell lines with different CF accumulation have different glucose-6-phosphatase activities in crude microsomes and crude cytosols.
smlA−, Ax4 (WT), and countin− cells were starved by shaking in buffer, harvested at 6 h of starvation, and lysed by freezing/thawing. Cell lysates were then clarified by centrifugation, and the clarified lysates were further fractionated by ultracentrifugation to yield crude microsomes and crude cytosol. The activities of glucose-6-phosphatase in the crude microsomal fraction and crude cytosol fraction were then measured. The lines show Michaelis-Menten equations fit to the data using nonlinear regression. A, glucose-6-phosphatase activities were measured in crude microsomes normalized to the protein concentrations of crude microsomes from the three cell lines. Values are the means ± S.E. from seven independent assays. B, glucose-6-phosphatase activities were measured in crude cytosol fractions and normalized to the protein concentrations of the crude cytosol fractions from the three cell lines. Values are the means ± S.E. from seven independent assays. Arrows indicate the physiological concentration of glucose-6-phosphatase in wild-type cells (114 μm).

