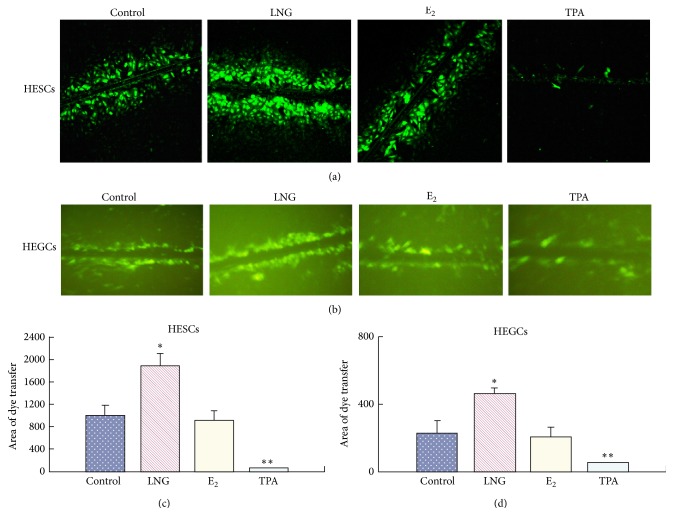
Figure 4.
GJIC changes in endometrial cells, measured by scrape loading (SL)/dye transfer (DT). HESCs and HEGCs cells were treated in the absence (control) or presence of 5 × 10⁻⁵ mol/L LNG or 5 × 10⁻⁵ mol/L E2 for 48 hs or in 10 ng/mL TPA for 2 hs. (a) Lucifer Yellow CH-recipient HESCs, observed by LSCM; (b) Lucifer Yellow CH-recipient HEGCs, observed by a reversed fluorescent microscope; ((c), (d)) The histogram representing the mean ± S.D. of the area of dye transfer for HESCs (c) or HEGCs (d) of 6 patients; ∗ P < 0.05, ∗∗ P < 0.01; there was a significant difference.

