
Figure 2. Increased local tumor recurrence and metastases in CXCR7ΔEND/ΔEND mice.
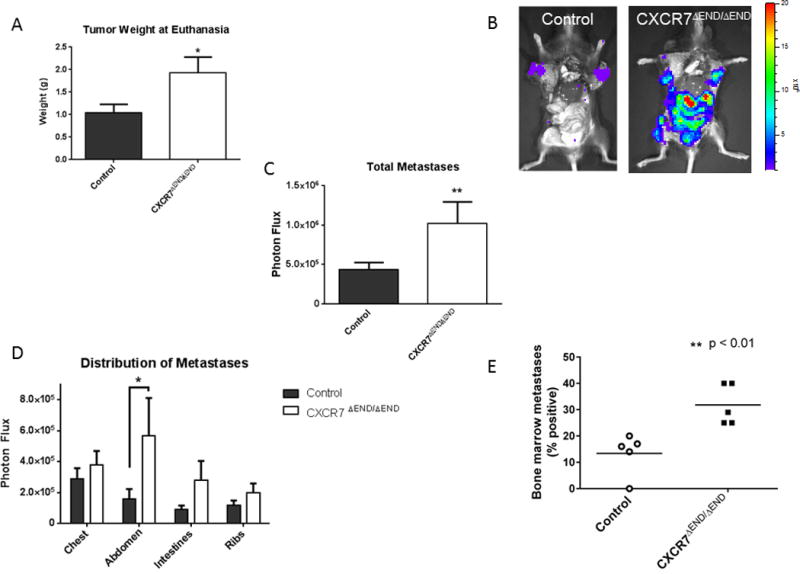
A) We resected recurrent tumors from mammary fat pads of CXCR7ΔEND/ΔEND and control mice at the time of euthanization. Weights of recurrent tumors are shown as mean values + SEM (n = 8 mice per group). B) Representative bioluminescence images of metastases in CXCR7ΔEND/ΔEND and control mice immediately after euthanization. C) We quantified total photon flux from AT-3-FL metastases in both groups of mice and graphed data as mean values + SEM. D) Graph shows mean values + SEM for bioluminescent metastases quantified at defined anatomic sites. E) We measured disseminated AT-3-FL cells recovered from bone marrrow of CXCR7ΔEND/ΔEND and control mice by ex vivo bioluminescence imaging and determined the percentage of mice in each group with detectable signal above background. Each data point shows percent of mice per group with disseminated tumor cells in bone marrow from five independent experiments (n = 8–10 mice per group per experiment). Horizontal line denotes the mean for each group. *, p < 0.05; **, p < 0.01.