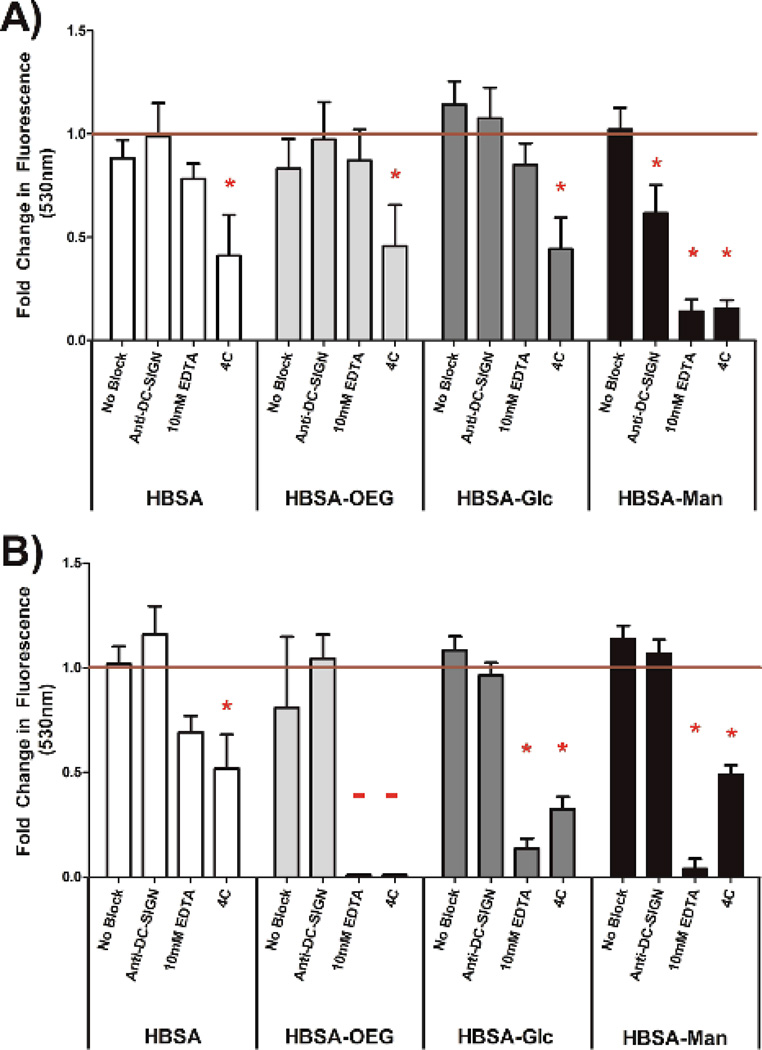
Figure 5.
Quantification of internalized fluorescent conjugates presented in an AW modality (A) and 5 µg/ml soluble conjugates (B) in the presence of no blocking agent, CLR blocking antibody, EDTA, or 4°C treatment.Net fluorescence measured by subtracting signal from DCs treated with non-fluorescent equivalent conjugate. Data is shown as fold change for DCs treated with the isotype control for the respective blocking anti-body. N=3 donors. Error bars represent standard error, red line indicates mean isotype control treated cells’ internalization of beads fluorescence, * indicates statistical difference from isotype control treated cells.

