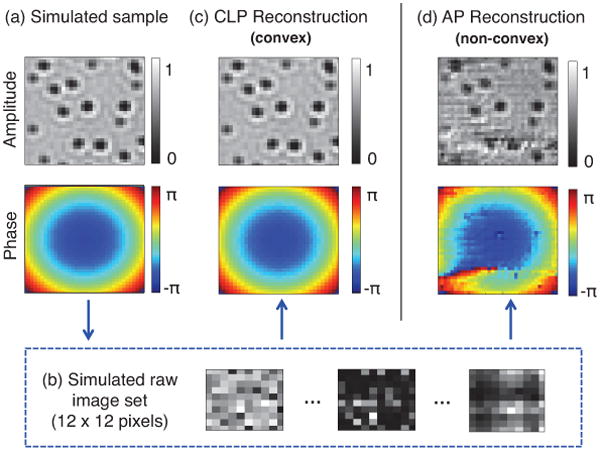
Figure 3.

Simulation of the CLP algorithm. (a) An n = 36 × 36 pixel complex sample (simulated) consisting of absorptive microspheres modulated with an independent quadratic phase envelope. (b) Sequence of low-resolution simulated intensity measurements (m = 12 × 12 pixels each), serving as algorithm input. (c)-(d) Example CLP and AP reconstructions, where CLP is successful but AP converges to an incorrect local minimum. Here we use q = 82 images to achieve a resolution gain of 3 along each spatial dimension and simultaneously acquire phase.
