
Figure 4.
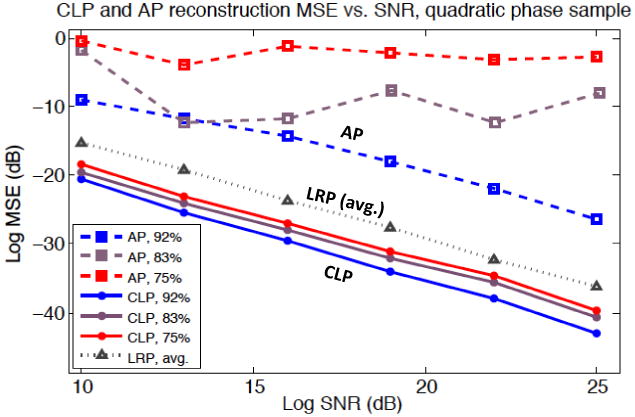
Reconstruction MSE versus signal to noise ratio (SNR) of CLP and AP (log scale, dB). Each curve represents reconstruction with a different number of captured images, q, corresponding to a different percentage of spectrum overlap (ol, noted in legend). Each point is an average over 5 independent algorithm runs with unique additive noise. Also included is the average performance of our LRP algorithm over the same 3 spectrum overlap settings (see Section 4).