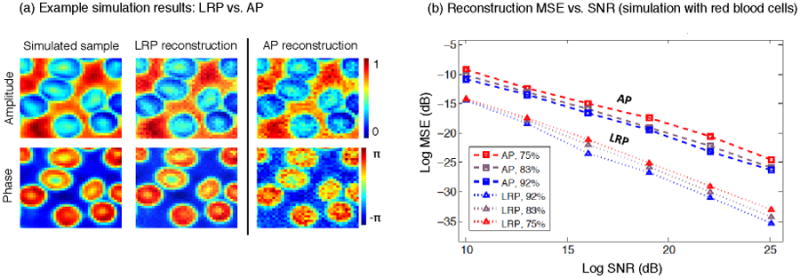
Figure 5.

Simulation of the LRP and AP algorithms using the same parameters as for figures 3–4, but now with a different “red blood cell” sample, (a) Using 82 simulated intensity measurements as input (SNR=19, 122 pixels each), both algorithms successfully recover each cell's phase, but AP is less accurate, (b) MSE versus SNR plot with varying amounts of noise added to the same data set. The MSE for LRP is ∼5-10 dB lower than for AP across all noise levels and aperture overlap settings (each point from 5 independent trials).
