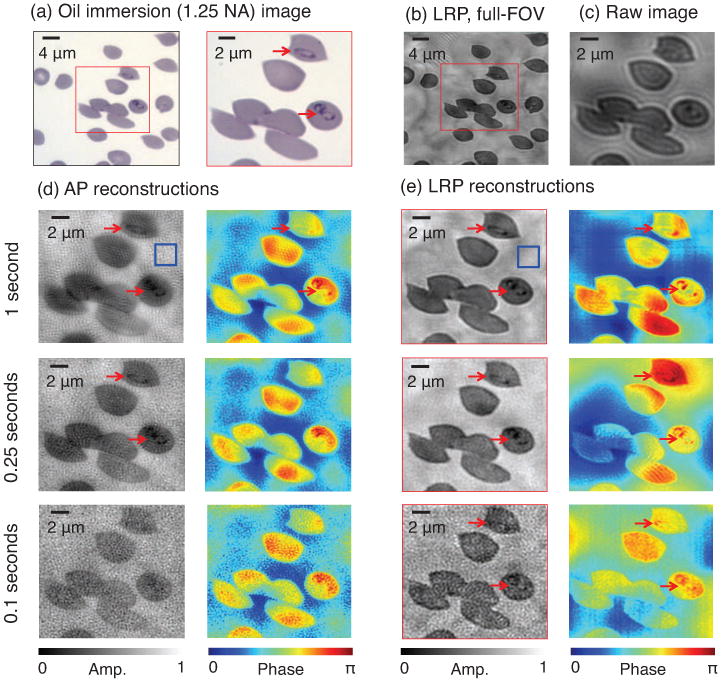
Figure 8.

Experimental reconstruction of malaria-infected human red blood cells. (a) Oil immersion microscope image (1.25 NA) identifies two infected cells of interest (marked with arrows). (b) Example LRP reconstruction (area of interest in red box). (c) One example raw image used for AP and LRP algorithm input. (d) AP-reconstructed amplitude and phase from three different 29-image data sets, using 1 sec (top), 0.25 sec (middle) and 0.1 sec (bottom) exposure times for all images in each set. Variances measured within blue boxes. Increased noise within short-exposure images deteriorates reconstruction quality until both parasites are not resolved. (e) LRP reconstructions using the same three data sets. Both parasites are clearly resolved in the reconstructed phase for all three exposure levels.
