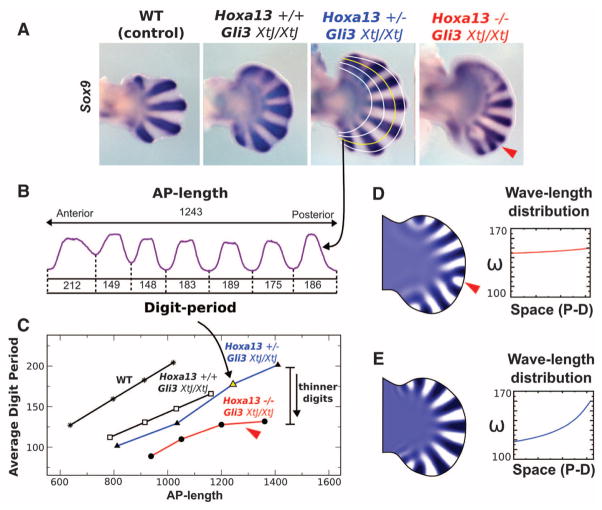
Fig. 1.
(A) Expression of Sox9 in E12.5 limbs of the Hoxa13;Gli3 allelic series. Note the delayed differentiation in the anterior mesoderm in the absence of Gli3. The curved white and yellow lines show the AP profiles used for the analysis of Sox9. The red arrowhead points to a digit bifurcation. WT, wild type. (B) Sox9 staining intensity along the yellow profile indicated by the curved arrow. AP length and the period of each digit (from minimum to minimum) are measured and shown for Hoxa13+/−;Gli3XtJ/XtJ. (C) Chart showing the average digit periods versus AP lengths for each profile and limb. A linear relation is observed in controls and in the Gli3XtJ/XtJ background for either the normal or heterozygous dose of Hoxa13, whereas a flatter relation that correlates with bifurcations (red arrowhead) is observed in the Hoxa13−/−;Gli3XtJ/XtJ limbs (red line). The curved arrow marks the yellow point corresponding to the profile in (B). (D and E) Two simulations of the reaction-diffusion model inside an E12.5 Gli3 mutant limb shape. (D) The activator concentration obtained in the simulation with a uniform modulation of wavelength ω (shown in the graph) shows digit bifurcation (red arrowhead) similar to the Hoxa13−/−Gli3XtJ/XtJ mutants. (E) The simulation result when wavelength is modulated according to a suitable PD gradient (in this case, a 2D gradient of simulated FGF signaling activity) avoids bifurcations, because the wavelength increases with increasing AP length. Limbs shown in all figures are forelimbs with distal to the right and anterior to the top.

