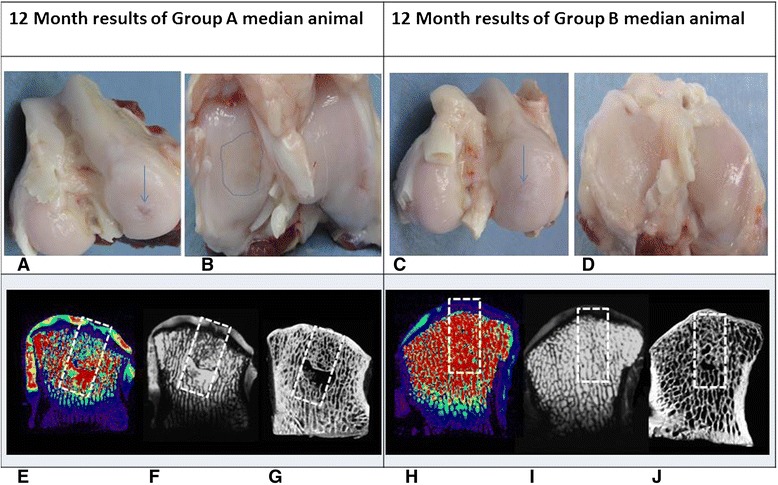
Fig. 4.

Results at 12 months post implantation of the median animal from group A (left column) and the median animal from group B (right column) using several evaluation modalities: a Macroscopic appearance of group A defect; a crater is visible at the site of the osteochondral defect (arrow). b Opposing articular surface of the tibia of same animal as (a) demonstrates a large area of tibial cartilage damage (dashed line). c Group B animal condyle appears to be perfectly covered with cartilage. d Opposing tibial cartilage in a group B animal is intact. e T2 mapping of a group A animal demonstrates abnormal signal indicating cartilage degeneration both overlying the defect (dashed box) and in the surrounding tissue. f T2 MRI scan demonstrates a cyst in the subchondral bone and abnormal dark signal in the superficial repair tissue supporting a fibrous content of the tissue. g A CT scan demonstrates some bone formation within the defect surrounding a large cyst and a lack of subchondral bone plate reconstruction. h Group B median animal demonstrates normal T2 mapping both within the tissue overlying the implant and in the periphery. Note the zonation of the repair tissue (blue-hued tissue overlying a purplish zone that is attached to the bone) indicating a likely hyaline cartilage nature of the repair tissue. i T2 scan of a group B animal indicates excellent subchondral bone regeneration with superficial tissue formation whose signal is typical of hyaline cartilage. j On CT scan, the bone tissue is fully reconstructed and the subchondral bone plate is similar in thickness and contour to its surroundings
